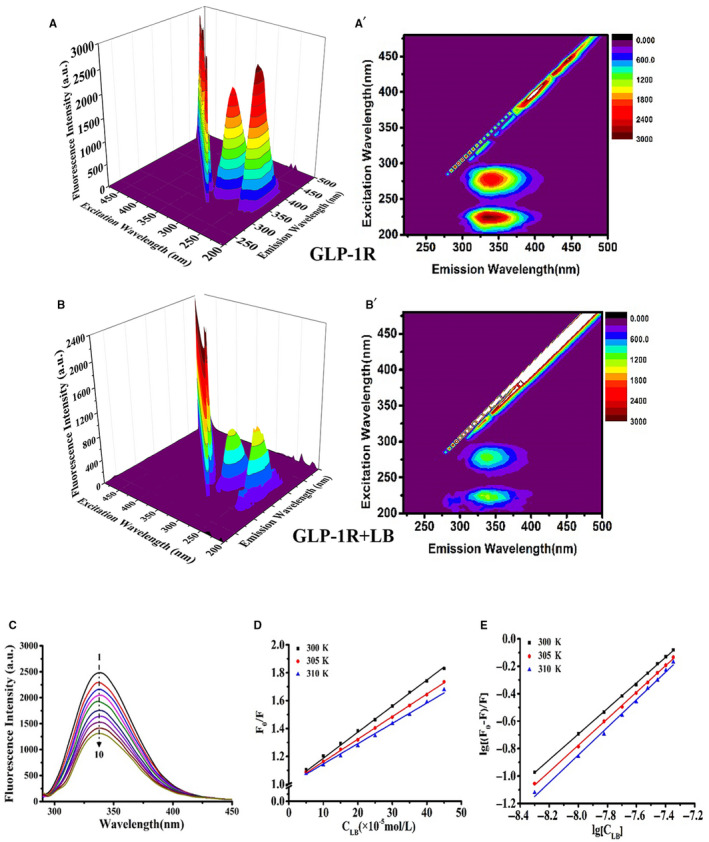
Figure 4.

Three‐dimensional fluorescence spectra, two‐dimensional fluorescence spectra, fluorescence quenching Stern‐Volmer diagram and quenching double reciprocal curve of the interaction between LB and GLP‐1R. (A‐B) 3D Fluorescence Spectra of LB and GLP‐1R. (C) 2D fluorescence spectroscopy, GLP‐1R' concentration constant (2.5 × 10‐8 mol/L) while varying the LB concentration from 0 mol/L to 4.5 × 10‐7 mol/L (line 1‐10, increasing 5 × 10‐8 mol/ L in turn). (D) Stern–Volmer curves of GLP‐1R fluorescence quenched LB. (E) Double‐log plots of LB quenching effect on GLP‐1R's fluorescence
