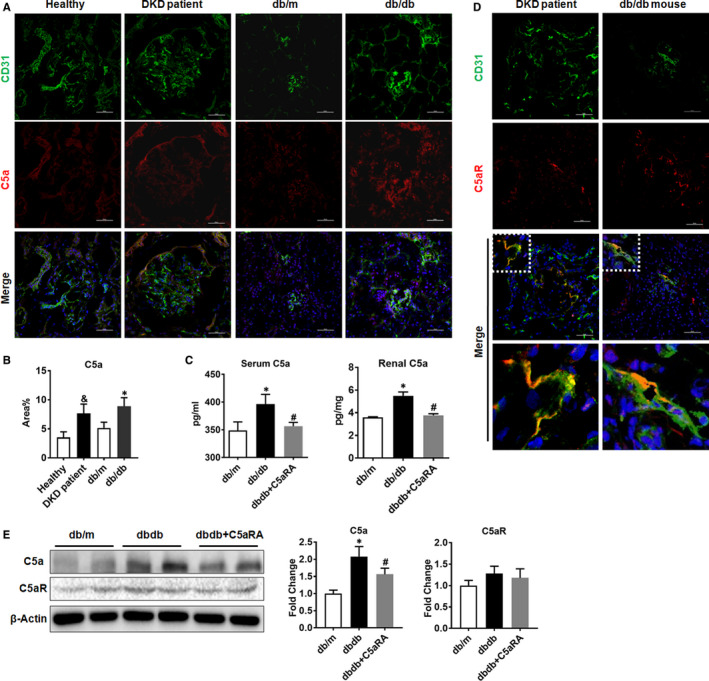
FIGURE 1.

Increased complement C5 activation in kidneys of DKD patients and db/db mice. (A) Double‐IF staining of C5a and CD31 in the kidneys of humans and mice (scale bar = 50 µm). (B) The fluorescent intensity of C5a in kidney detected by IF staining. (C) The concentration of C5a in serum and renal tissue of mice measured by ELISA. (D) Double‐IF staining of C5aR and CD31 in the kidneys of humans and mice (scale bar = 50 µm). (E) The protein level of C5a and C5aR in kidney of mice measured by Western blot. & P < .05, DKD patient vs Healthy. *P < .05, db/db or db/db + C5aRA group vs db/m; # P < .05, db/db + C5aRA group vs db/db group
