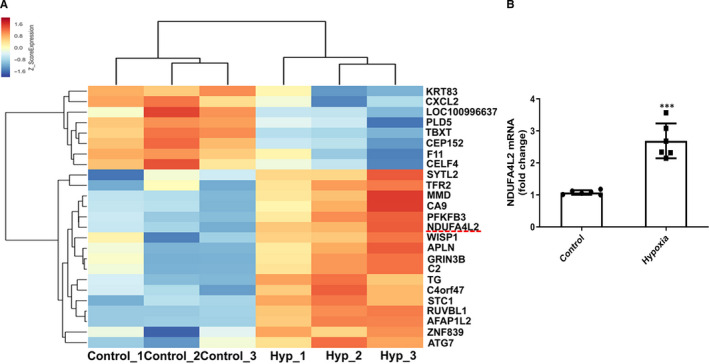
Figure 1.

Analysis of mRNA expression profiles of normoxia and hypoxia in HPASMCs. A, Heat map of the up‐regulated and down‐regulated genes which were related to hypoxic PASMC proliferation and analysed by RNA sequencing (n = 3); (B) Real‐time PCR was used to detect mitochondrial NDUFA4L2 mRNA expression in normal and hypoxic HPASMCs (n = 6). Hyp, hypoxia. ***P < .001 vs control. All of the values are denoted as mean ± SEM
