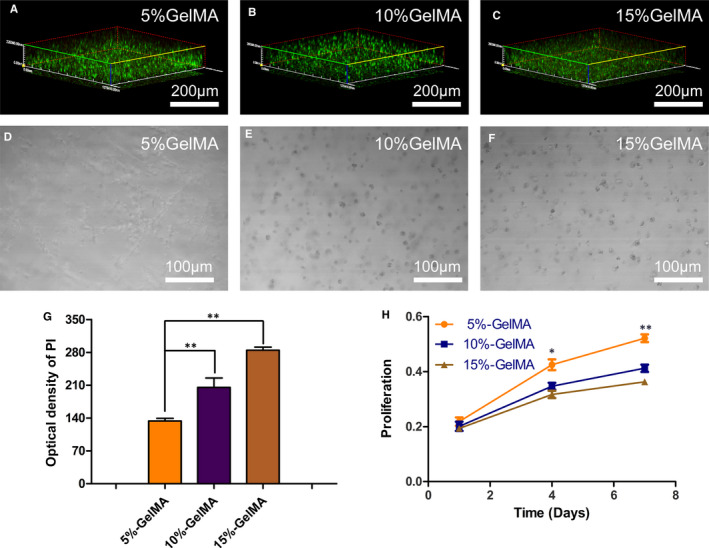
FIGURE 3.

Cytocompatibility of NPCs and GelMA hydrogel. (A‐C) Live/dead staining analysis of NPCs encapsulated in GelMA hydrogel on day 7, Calcein‐AM (green) to indicate live cells and PI (red) to indicate dead cells. (D‐F) After 7 days of culture, 3D images showed that the elongation length of the cells was inversely proportional to GelMA hydrogel concentration. (G) Quantitative analysis of dead cells in the hydrogel. (H) Cell proliferation of NPCs encapsulated in GelMA hydrogel at days 1, 4 and 7, respectively (*P < .05, **P < .01)
