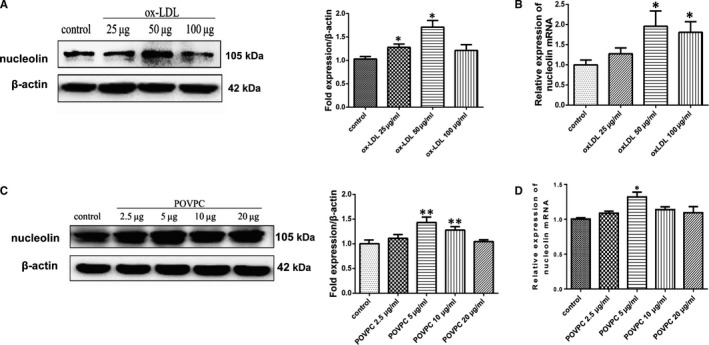
Figure 2.

POVPC or ox‐LDL up‐regulated nucleolin mRNA and protein expression in HAVSMCs. (A and C) Representative Western blot showing nucleolin levels in VSMCs treated with POVPC or ox‐LDL. *, P < .05, **, P < .01, compared with control, n = 3. (B and D) RT‐qPCR gene expression analysis of VSMCs treated with different stimuli. Unpaired 2‐tailed Student's t test was used to compare means for A‐D. *, P < .05, compared with control, n = 3
