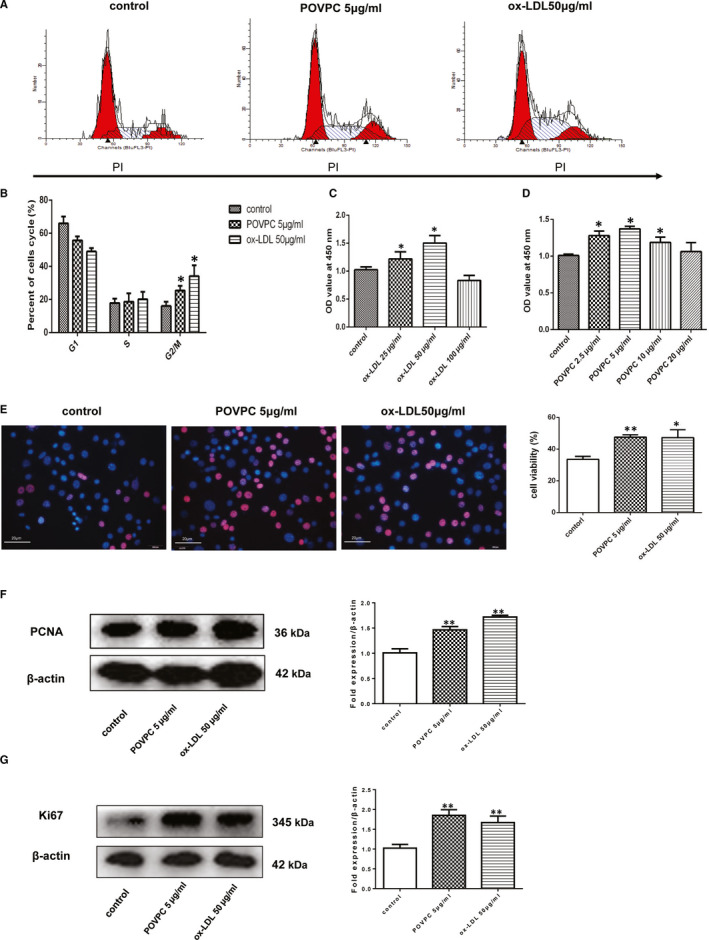
Figure 3.

POVPC‐induced or Ox‐LDL‐induced the cell cycle changes in vascular smooth muscle cells. (A). POVPC‐induced or ox‐LDL‐induced the cell cycle changes in vascular smooth muscle cells. The cell cycle distribution was determined by assessing the individual nuclear DNA content reflected by the fluorescence intensity of incorporated propidium iodide. Flow cytometric analysis of VSMCs without any treatment (control), VSMCs induced by POVPC or ox‐LDL, respectively. (B) Percentages of cells in G0/G1, S and G2/M phases after the indicated treatments. Representative flow cytometry graphs are shown, and results are expressed as the mean ± standard deviation from three independent experiments. (C‐D) VSMCs were treated for 24 h with different concentrations of POVPC or ox‐LDL for 24h. Cell viability was assessed by the CCK‐8 method. POVPC or ox‐LDL treatment significantly increased the cell viability. Values are expressed as the mean ± standard deviation from three independent experiments. VSMC, vascular smooth muscle cell; ox‐LDL, oxidized low‐density lipoprotein; POVPC, 1‐palmitoyl‐2‐oxovaleroyl‐sn‐glycero‐3‐phosphorylcholine. n = 10, * P < .05, vs. the control group. (E) Representative images of EdU staining. Edu staining was revealed with a red fluorescence signal; bar diagrams showing the number of EdU‐positive cells; Immunostaining for SMA (red) and hoechst (blue), n = 9, *P < .05, ** P < .01, vs. the control. (F) Representative Western blot showing PCNA levels in VSMCs treated with POVPC or ox‐LDL. n = 3, ** P < .01, vs. the control. (G) Representative Western blot showing Ki67 levels in VSMCs treated with POVPC or ox‐LDL. n = 3, **, P < .01, vs. the control group. Unpaired 2‐tailed Student's t test was used to compare means for A‐G
