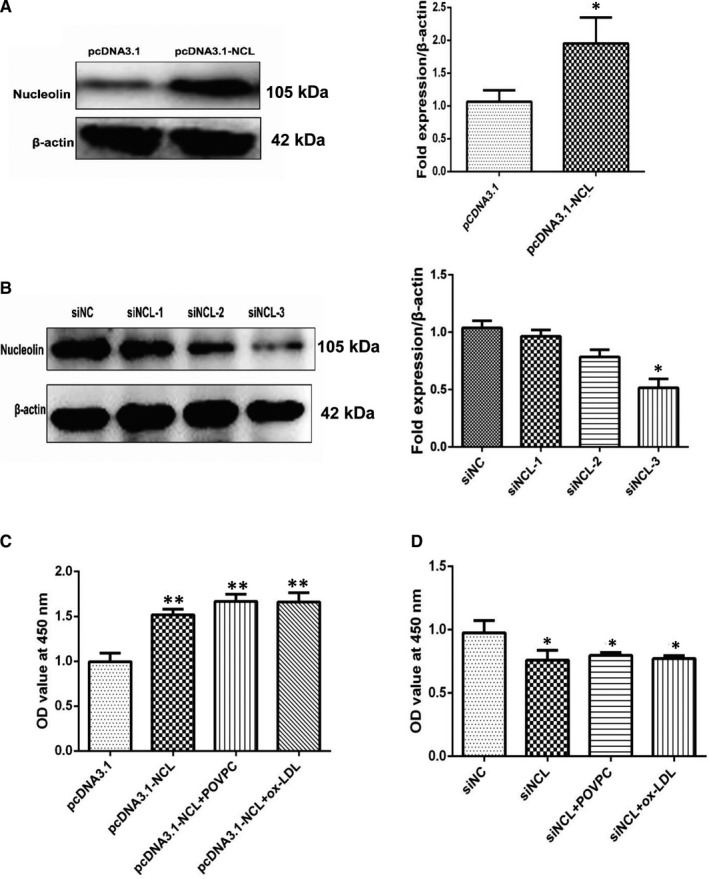
Figure 4.

The cell proliferation ability changed after interference with the expression of nucleolin. (A) The protein expression of nucleolin fusion protein in vascular smooth muscle cells after transfection with pcDNA3.1‐NCL for 48 hours. The right‐hand side showed the grey ratio analysis of nucleolin/ β‐actin. *, P < .05, compared with vector control (pcDNA3.1), n = 3. (B) The expression of nucleolin protein in vascular smooth muscle cells after transfection with nucleolin specific siRNA. The right‐hand side showed the grey ratio analysis of nucleolin/actin. *, P < .05, compared with negative control (siNC), n = 3. (C) The effect of nucleolin siRNA on cell viability in VSMCs. *, P < .05, vs siNC group, n = 6. (D) The effects of nucleolin overexpression on cell viability in VSMCs. **, P < .01, vs pcDNA3.1 group, n = 6. P‐values were determined using the two‐tailed Student's t test for comparing two groups and one‐way ANOVA for comparing multiple groups
