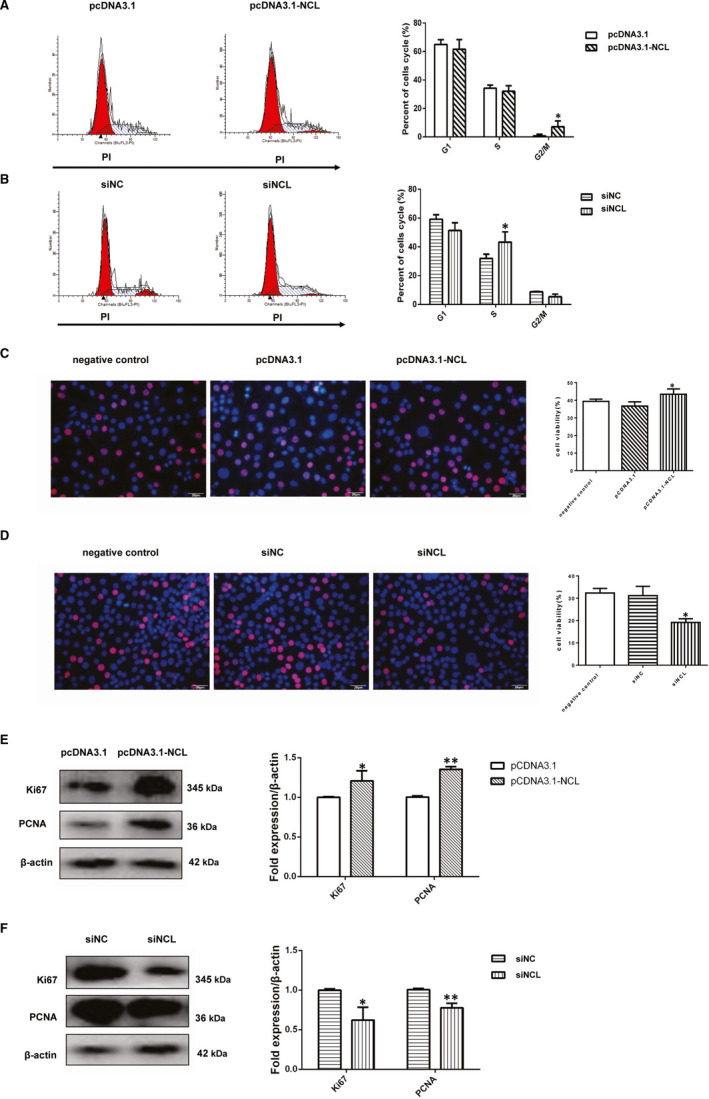
Figure 5.

Nucleolin ablation or overexpression change the cell cycle progression of VSMCs. (A) The cell cycle changes in vascular smooth muscle cells after transfected with pcDNA3.1 or pcDNA3.1‐NCL. Percentages of cells in G0/G1, S and G2/M phases after the indicated transfected treatments. Representative flow cytometry graphs are shown, and results are expressed as the mean ± standard deviation from three independent experiments, *, P < .05, vs pcDNA3.1 group (vector control), n = 3. (B) The cell cycle changes in vascular smooth muscle cells after transfected with siNCL or siNC. Percentages of cells in G0/G1, S and G2/M phases after the indicated transfected treatments. *, P < .05, compared with siNC (negative control), n = 3. (C) Representative images of EdU staining in vascular smooth muscle cells after transfected with negative control, pcDNA3.1 or pcDNA3.1‐NCL. EdU‐positive cells increased significantly in pcDNA3.1‐NCL group and the percentage of EdU‐positive cells was calculated, EdU (red) and hoechst (blue), n = 6, *, P < .05, compared with the pcDNA3.1 group. (D) Representative images of EdU staining in vascular smooth muscle cells after transfected with negative control, siNC or siNCL. EdU‐positive cells(red) decreased in siNCL group and the percentage of EdU‐positive cells was calculated, n = 6, *, P < .05, compared with the siNC group. (E) Representative Western blot showing PCNA and Ki67 levels in VSMCs after transfected with pcDNA3.1 or pcDNA3.1‐NCL group. n = 3, *, P < .05, **, P < .01, compared with the pcDNA3.1 group. (F) Representative Western blot showing PCNA and Ki67 levels after transfected with siNC or siNCL group. n = 3, *, P < .05, **, P < .01, compared with the siNC group. P‐values were determined using the two‐tailed Student's t test for comparing two groups and one‐way ANOVA for comparing multiple groups
