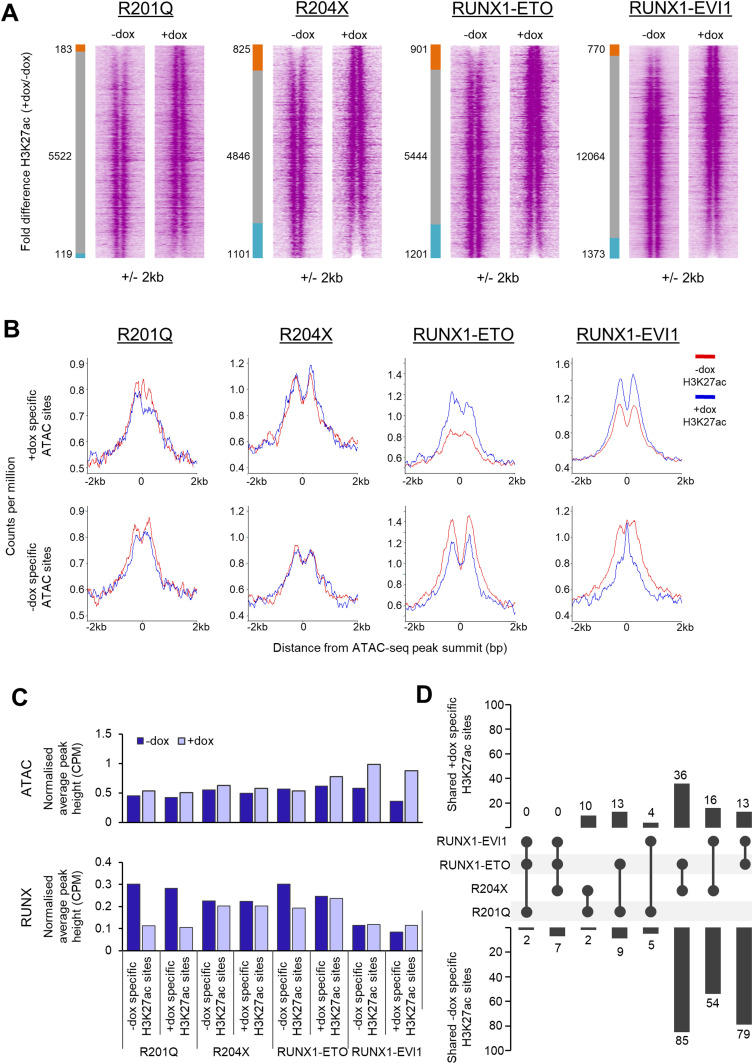
Figure 6. H3K27ac changes caused by RUNX1 mutants are not wholly dependent on changing chromatin accessibility.
(A) The H3K27ac ChIP-seq signal at open chromatin sites in progenitors was ranked by fold change of the +dox/−dox tag count and represented as density plots (±2 kb). The side bar indicates +dox-specific sites (orange), grey shared, and blue −dox-specific sites where specific sites are at least twofold different. The number of sites shared, lost or gained is indicated. (B) Average profiles of H3K27ac counts-per-million-normalised ChIP-seq signal in progenitors plotted around the differential distal ATAC sites identified in Fig 5 (±2 kb). (B, C) The counts-per-million-normalised average peak heights of ATAC-seq and RUNX1 ChIP-seq were calculated for the specific sites identified in (B). (B, D) The percentage of shared specific sites identified in (B) was calculated and shown by the bar graphs, where the circles indicate sets which have been overlapped in each case. Sets where there are no intersecting sites in either the − or +dox-specific sites are not shown.

