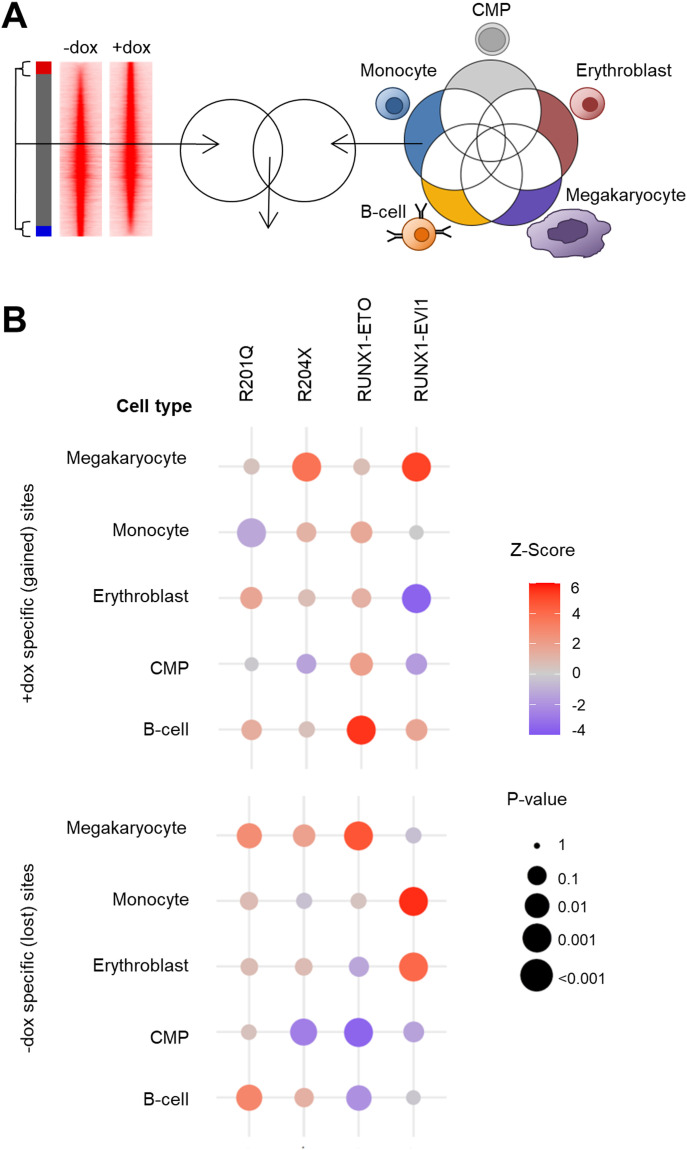
Figure 7. RUNX1 mutants disrupt RUNX1-driven chromatin priming.
(A) Scheme of how the enrichment of differentially accessible ATAC-seq peaks from Fig 2A, intersecting with ATAC peaks specific to common myeloid progenitors, B-cells, monocytes, erythroblasts or megakaryocytes was calculated. (B) Bubble plots showing the association of differentially accessible peaks after mutant RUNX1 induction with each peak set from the indicated cell types. Each bubble represents one intersection, the Z-score representing level of enrichment (red) or depletion of sites of each lineage (blue) as shown by the colour scale. The P-value is shown by the size of the circle.
Source data are available for this figure.

