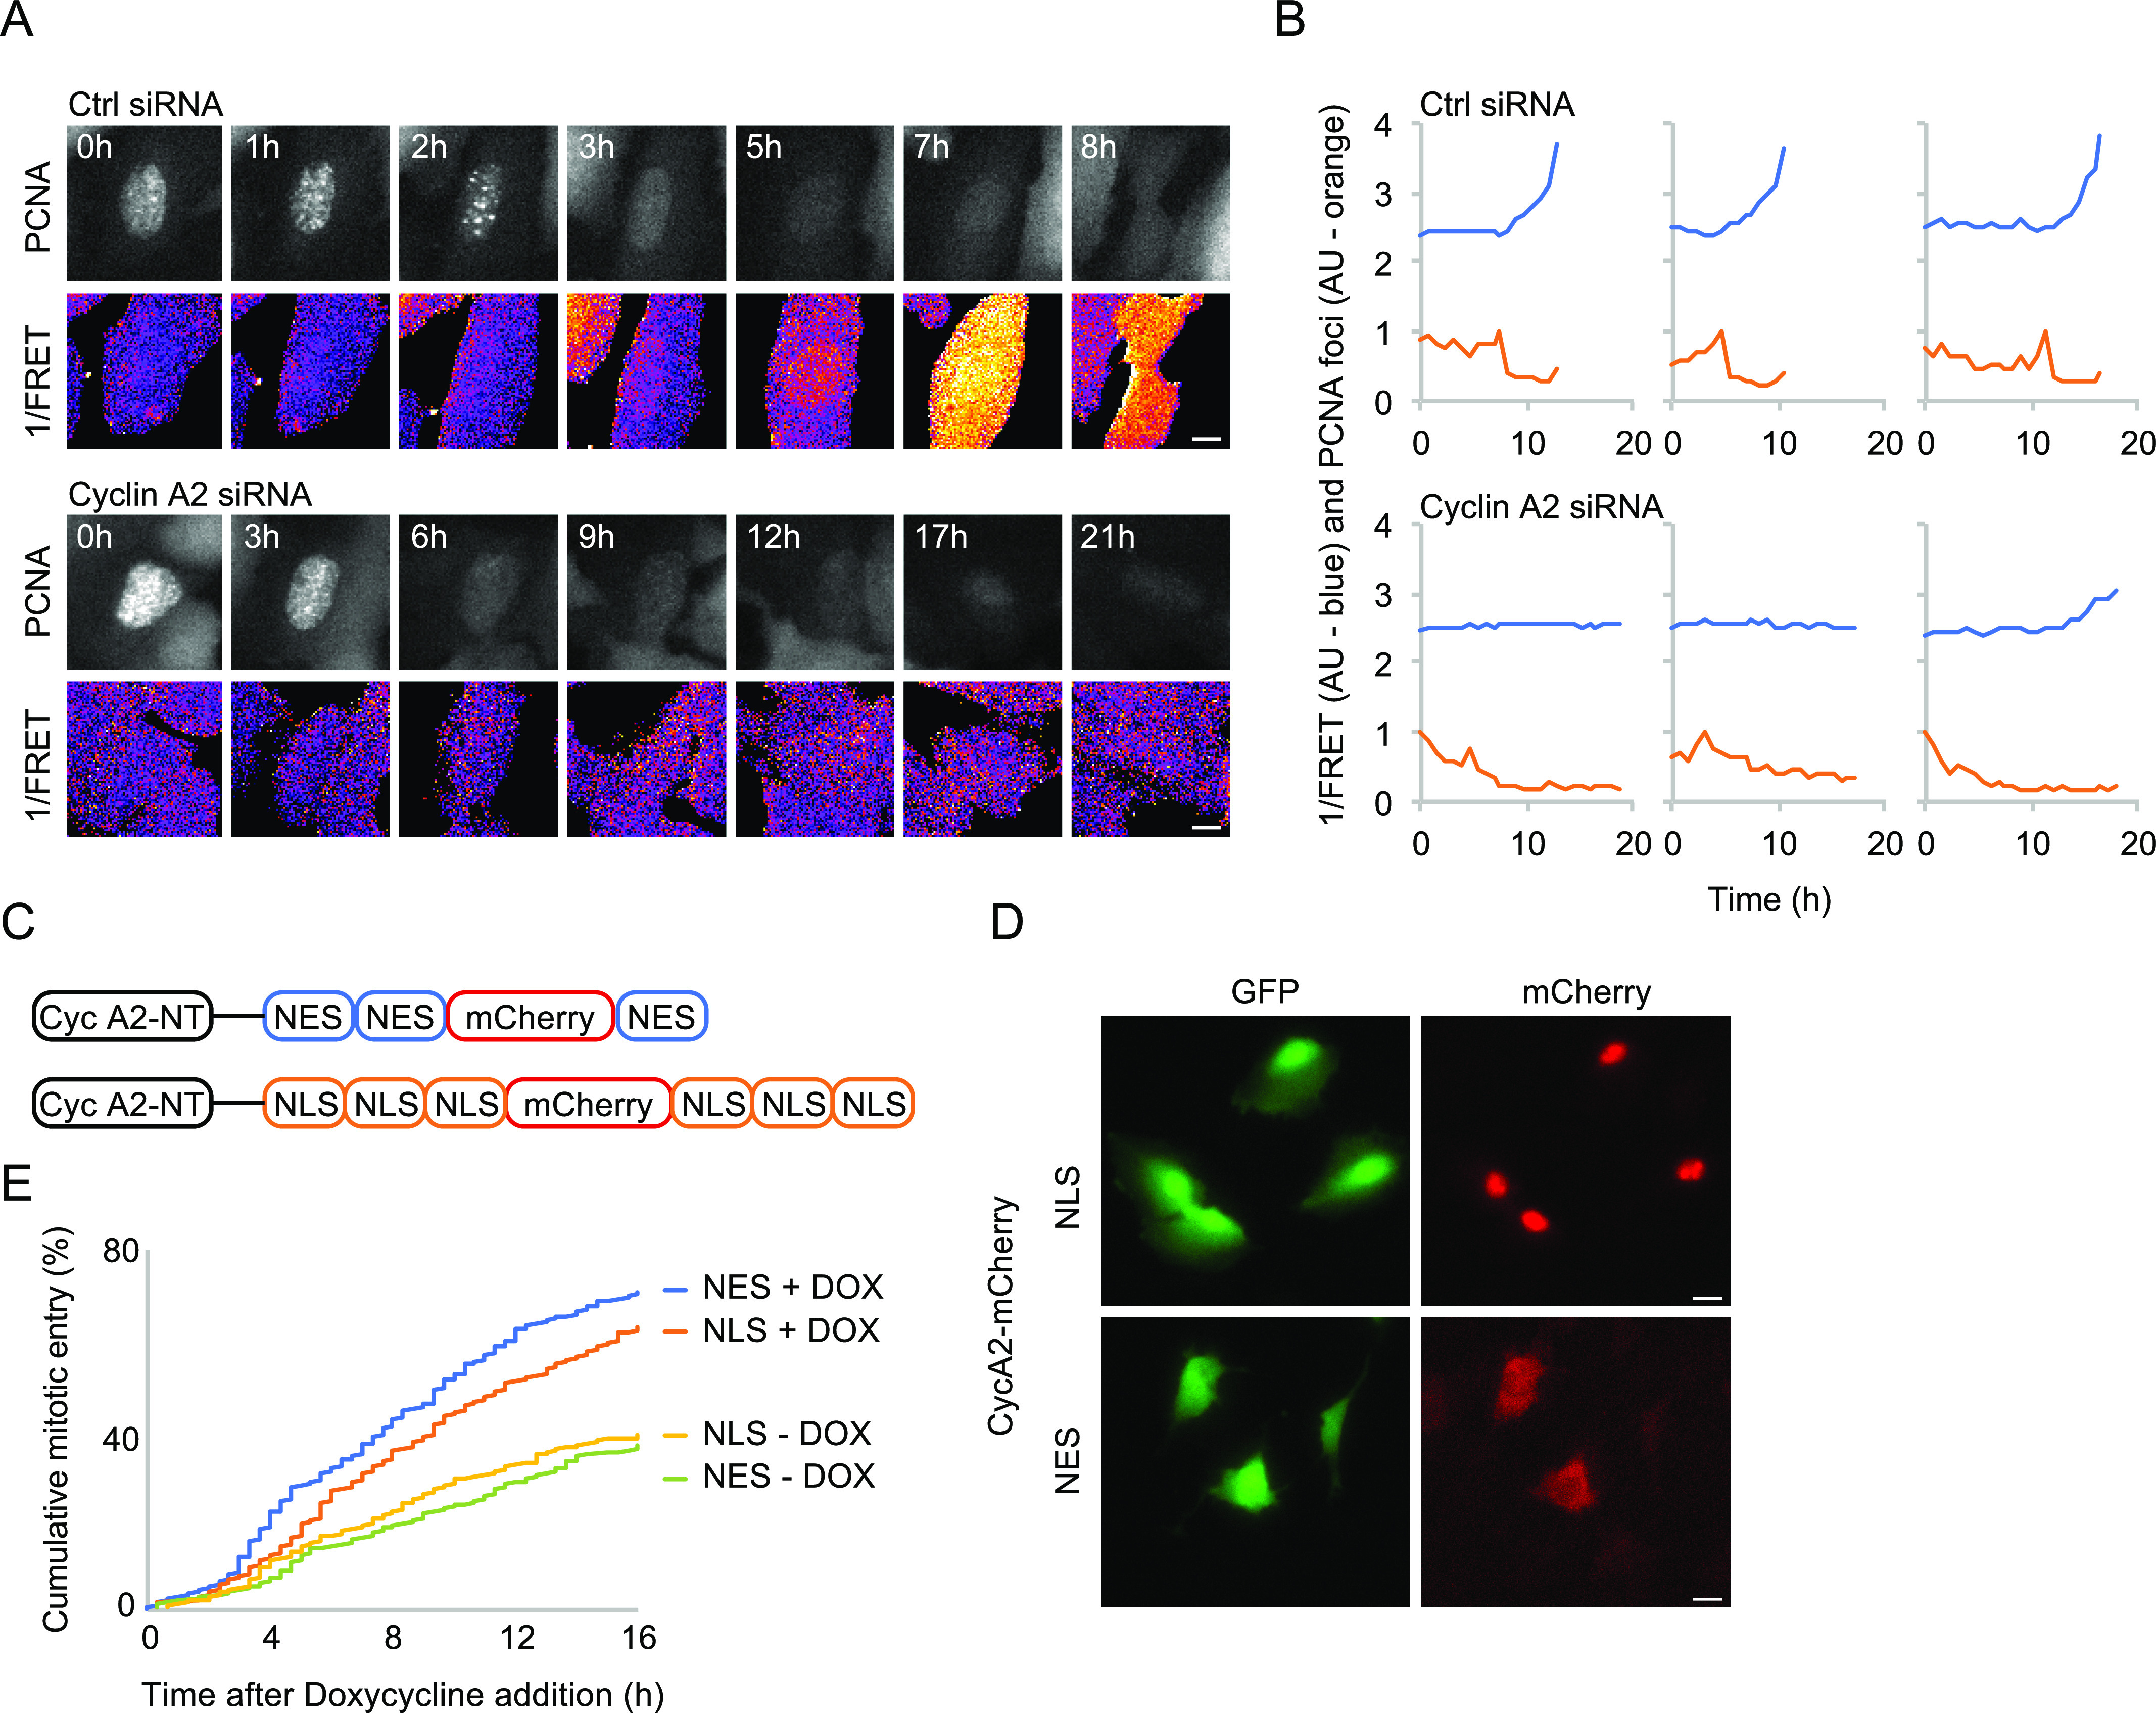
Figure 2. CycA2 containing nuclear export sequences can rescue cell cycle arrest after depletion of endogenous CycA2.

(A) Time-lapse sequence of U2OS cells expressing polo-like kinase 1 FRET reporter and PCNA chromobody. Time points (h) are indicated in figure. Top Ctrl siRNA, bottom CycA2 siRNA. Scale bar 10 μm. (B) Representative quantifications of individual cells, imaged as in (A). Red line shows 1/FRET and blue line shows PCNA foci. Please note that both pattern of polo-like kinase 1 activation and pattern of PCNA foci are altered after CycA2 siRNA. PCNA foci fluorescence is normalised on the maximal value, and 1/FRET is normalised on the minimal value. (C) Schematic of siRNA-non-targetable CycA2 expression constructs. (D) Images show RPE p53−/− TetON OsTIR, co-transfected with Piggy-BAC transposase, GFP flanked by Piggy-BAC integration sites (to mark transfected cells) and the constructs outlined in (C) after 18 h Doxycycline addition. Scale bar 20 μm. (E) Quantification of mitotic entry in GFP-expressing cells. Unsynchronised polyclonal RPE p53−/− TetON OsTIR populations treated as in (D) were transfected with CycA2 siRNA. 48 h later, cells were transferred to L15 medium with or without Doxycycline and GFP-expressing cells were followed by time-lapse microscopy. At least 275 cells were followed per condition.
