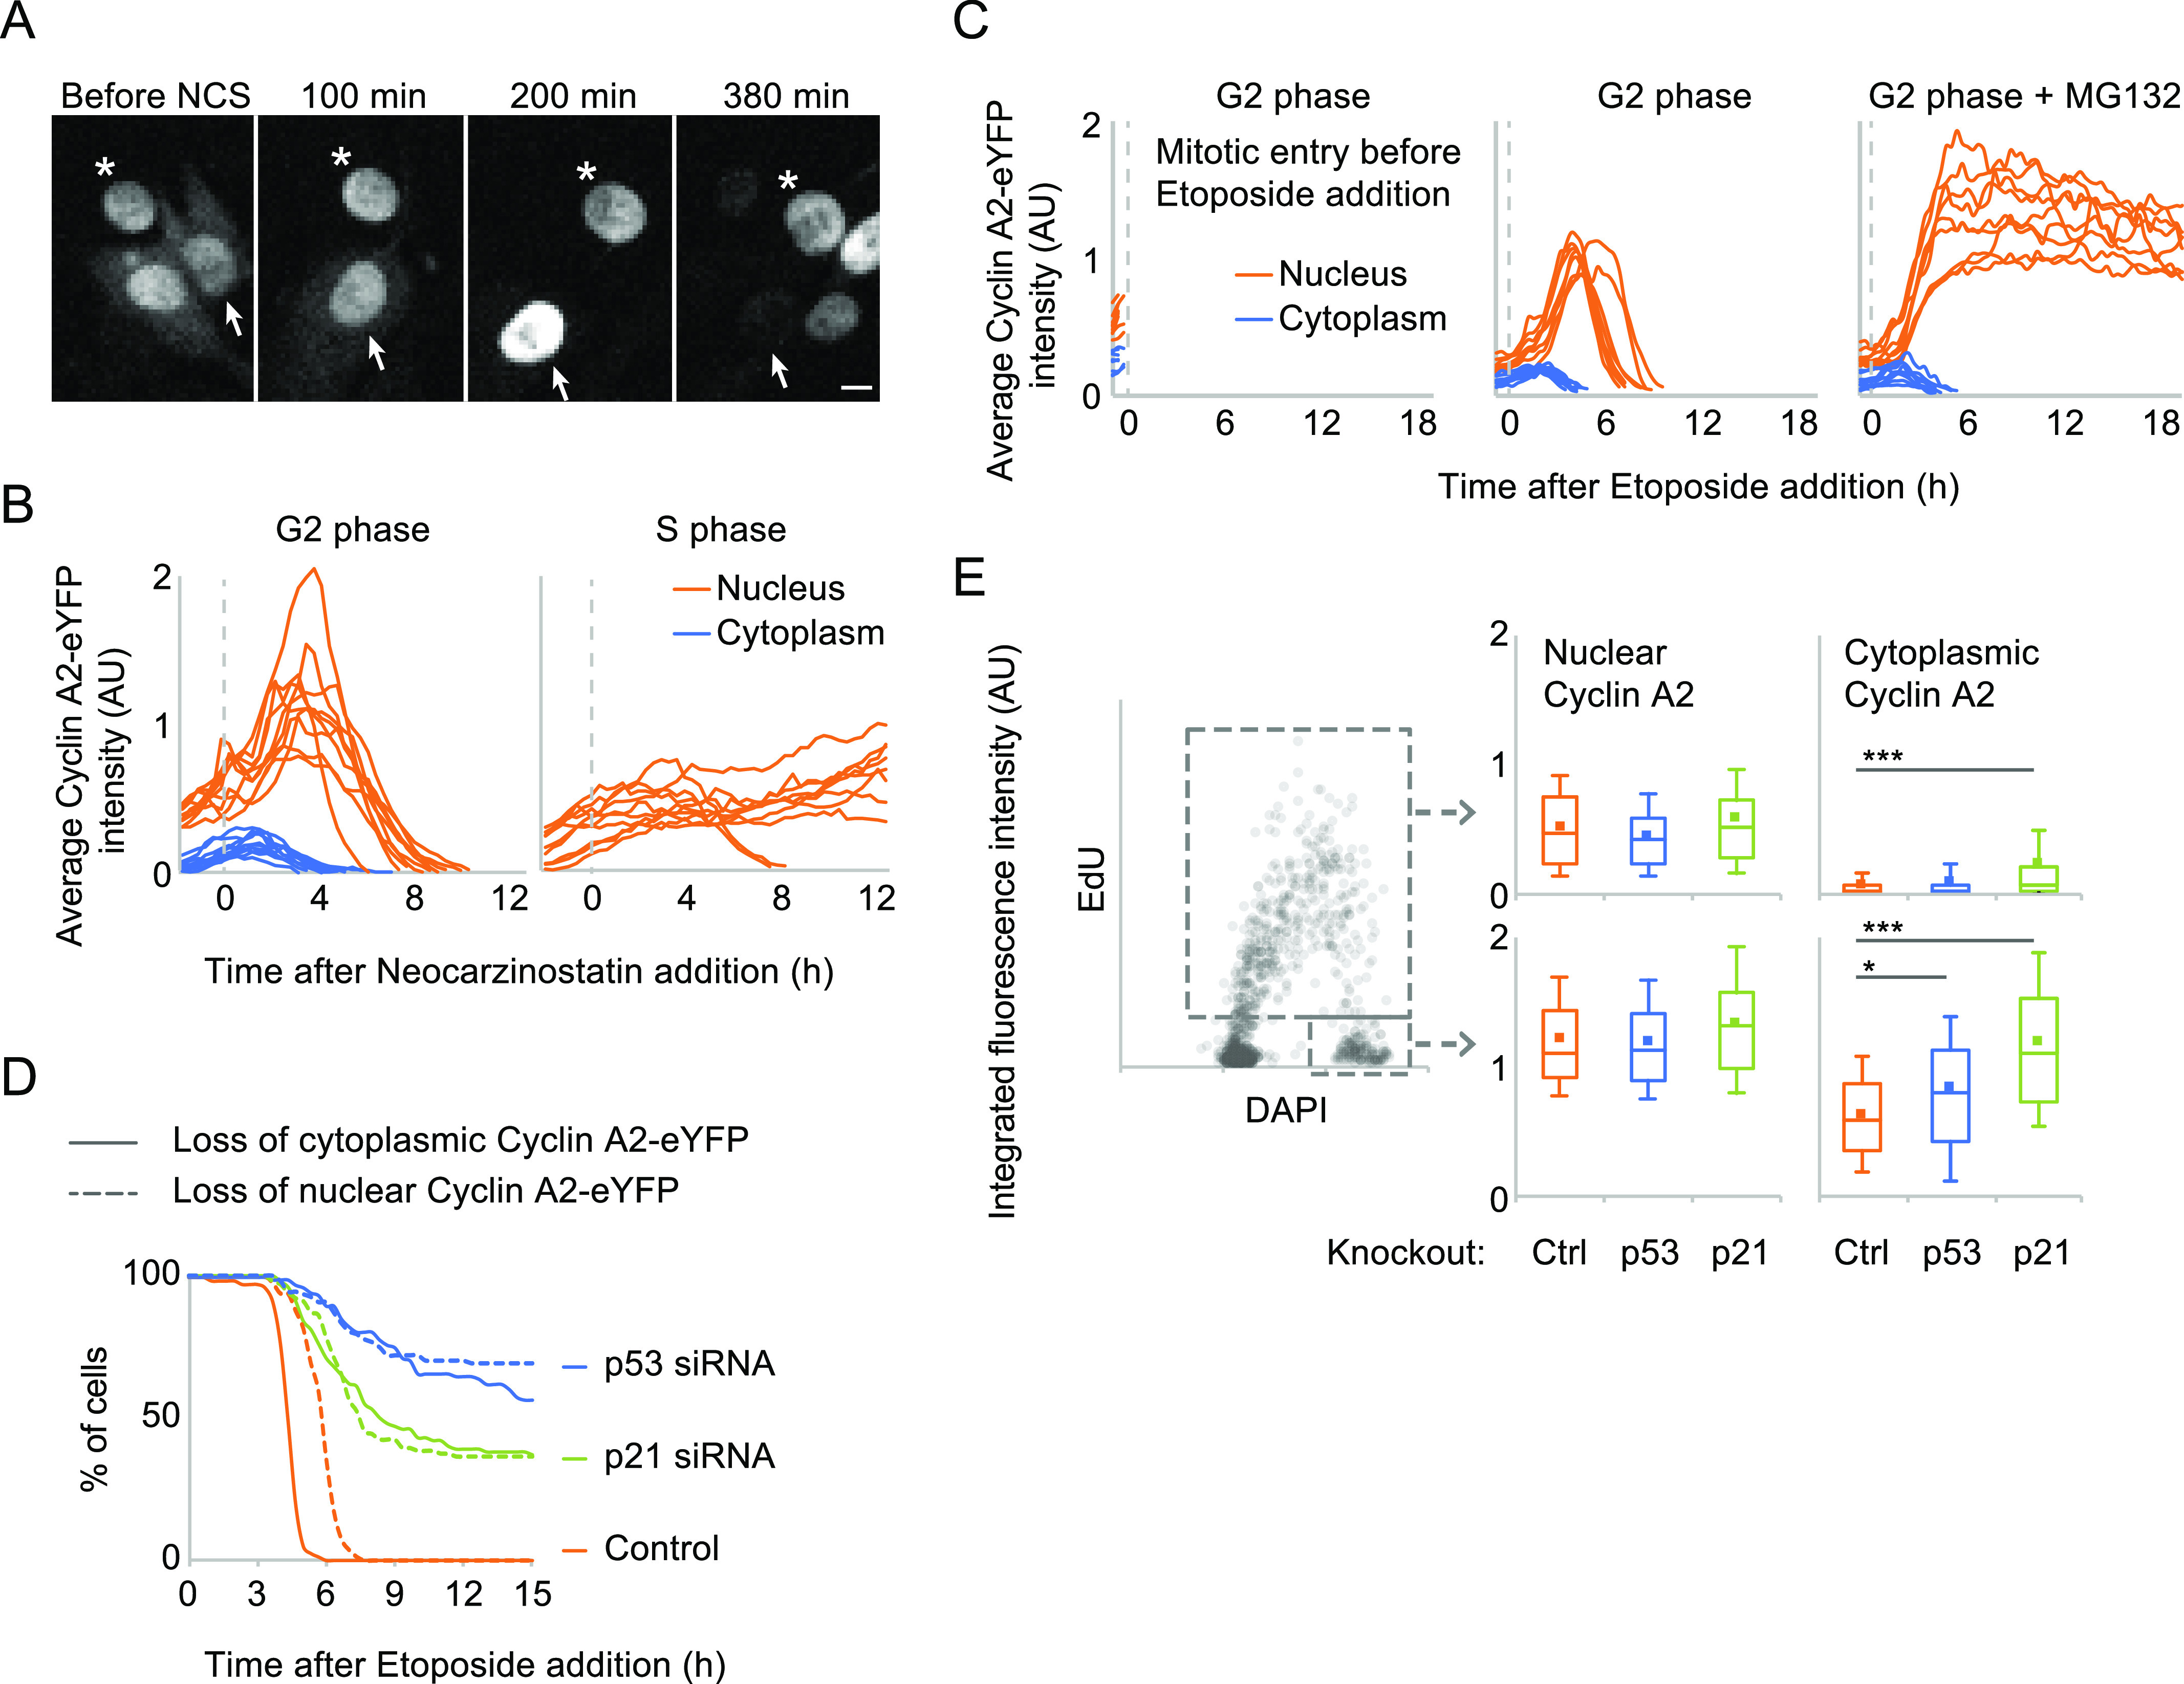
Figure 6. p21 can modulate cytoplasmic accumulation of Cyclin A2-eYFP.

(A) Time-lapse images of RPE CycA2-eYFP cells treated with 2 nM Neocarzinostatin (NCS). Asterisk indicates a cell exposed to NCS in the S phase, and arrow indicates a cell exposed to NCS in the G2 phase. Scale bar 10 μm. (B) Quantification of average nuclear and cytoplasmic CycA2-eYFP intensity after NCS addition. RPE CycA2-eYFP cells were imaged as in (A). Graphs show quantification over time in single cells, separated in cells showing cytoplasmic CycA2-eYFP at time of NCS addition (left, G2 phase, n = 10) or not (right, S phase, n = 10). No cell entered mitosis. (C) Quantification of average nuclear and cytoplasmic CycA2-eYFP intensity after etoposide and MG132 addition. RPE CycA2-eYFP cells that showed both nuclear and cytoplasmic fluorescence (G2 cells) at start of experiment were followed over time. Graphs show quantification over time in single cells, separated in cells entering mitosis before etoposide addition (left, n = 9, plotted until time point before mitosis), etoposide addition alone (middle, n = 8), etoposide, and MG132 addition (n = 9). (D) RPE CycA2-eYFP cells were transfected with p21, p53 or control siRNAs for 48 h and treated with etoposide at t = 0. Single cells were tracked over time and the time point of loss of CycA2-eYFP was determined visually. Graph shows cytoplasmic and nuclear loss of CycA2-eYFP of at least 100 cells that contained cytoplasmic CycA2-eYFP at time point of etoposide addition. (E) WT (ctrl), p21−/− or p53−/− RPE cells were incubated for 20 min with EdU and fixed. Graph to left shows quantification of integrated intensity of EdU staining versus nuclear DAPI intensity in at least 1,500 wt cells; each circle represents one cell. The large grey rectangle indicates gating for EdU positive cells (S phase) and the small grey rectangle indicates gating for EdU-negative 4N cells (G2). Box plots to right show 90, 75, 50, 25, and 10 percentiles of cells in S phase (top) and in G2 phase (bottom). Squares indicate average value. * indicates P < 0.05, *** indicates P < 0.0001, t test.
