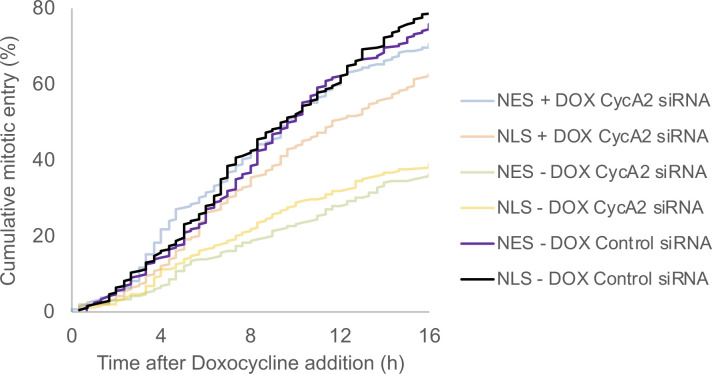
Figure S2. Mitotic entry of control siRNA treated cells.
Data from Fig 2E, with the addition of control siRNA treated cells (200 cells counted per condition). Please note that CycA2 siRNA leads to accumulation of G2 cells and that magnitude of rescue therefore cannot be determined by comparing control siRNA and CycA2 siRNA–treated cells.

