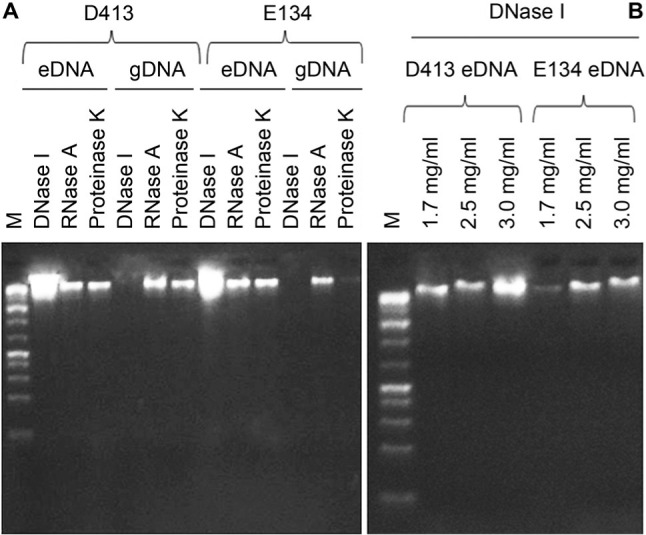
Fig. 1.

Agarose gel electrophoresis photographs displaying differences between the gDNA and eDNA of D413 and E134. M, Marker (Fermentas Gene Ruler 1 kb Plus DNA Ladder, 75–20.000 bp) (A) DNase I (1.45 mg/ml), RNase A (0.90 mg/ml) and proteinase K (0.85 mg/ml) treatment of both the gDNA and eDNA; (B) Different DNase I concentrations on eDNA (1.7, 2.5 and 3.0 mg/ml).
