
Fig. 1:
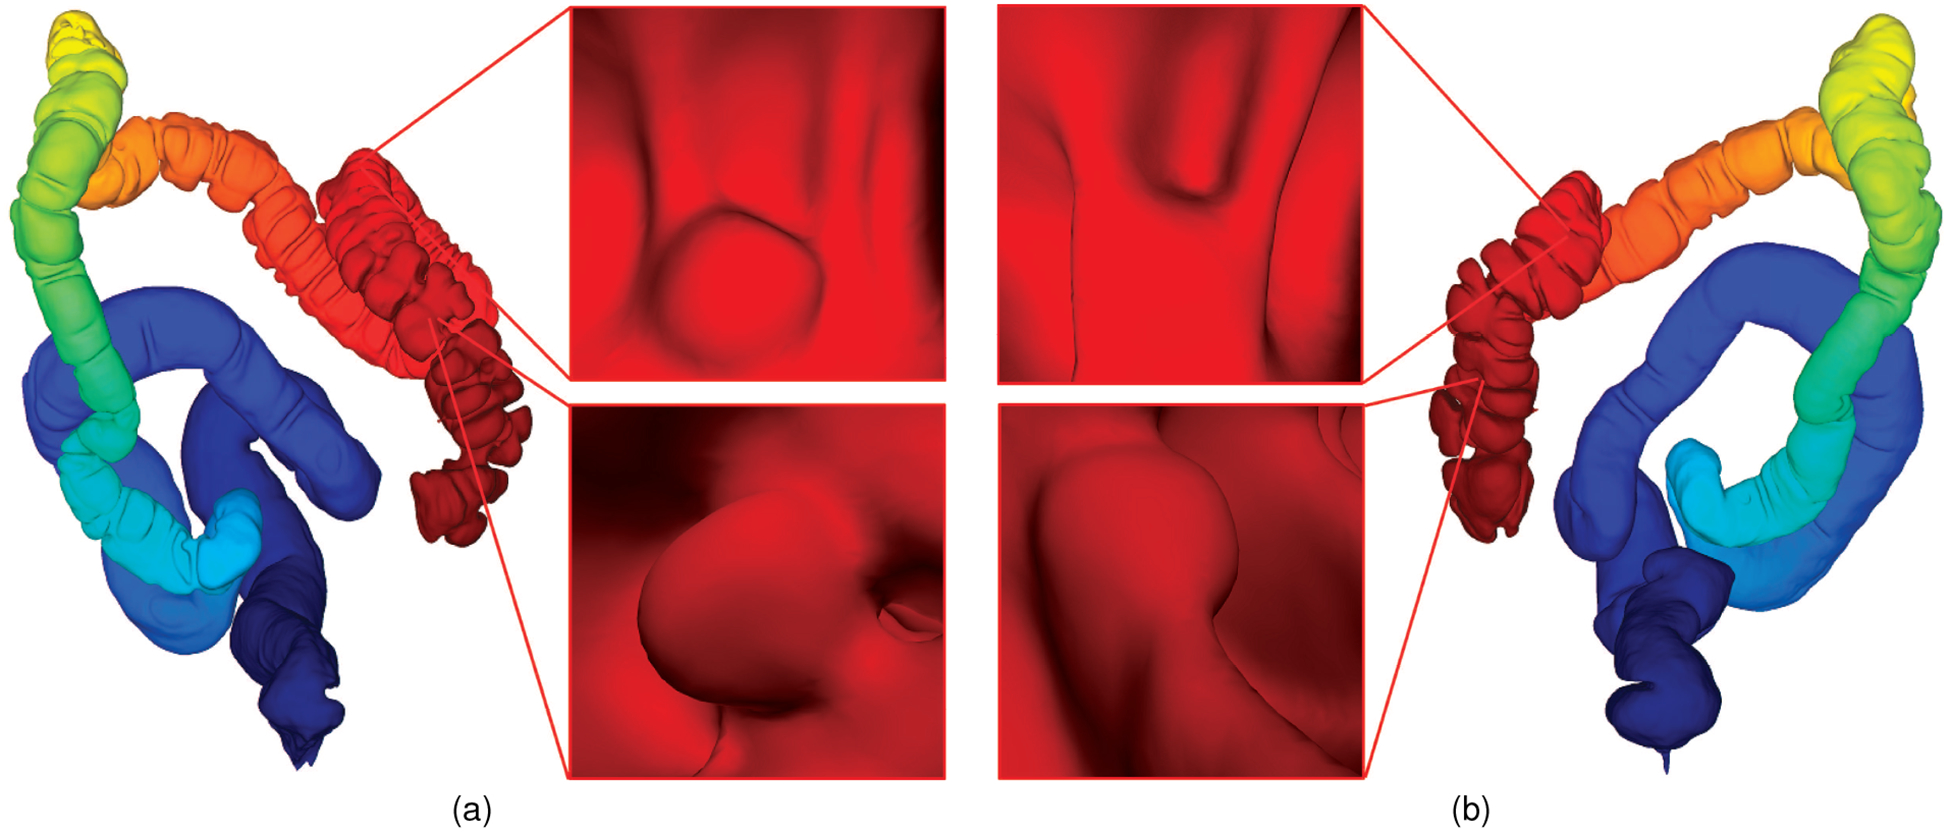
Corresponding supine and prone colon visualization. (a) A supine colon model with Fiedler vector representation and two polyps. (b) Registered prone model with corresponding polyps correlated in the endoluminal view with those in the supine model.