
Fig. 5:
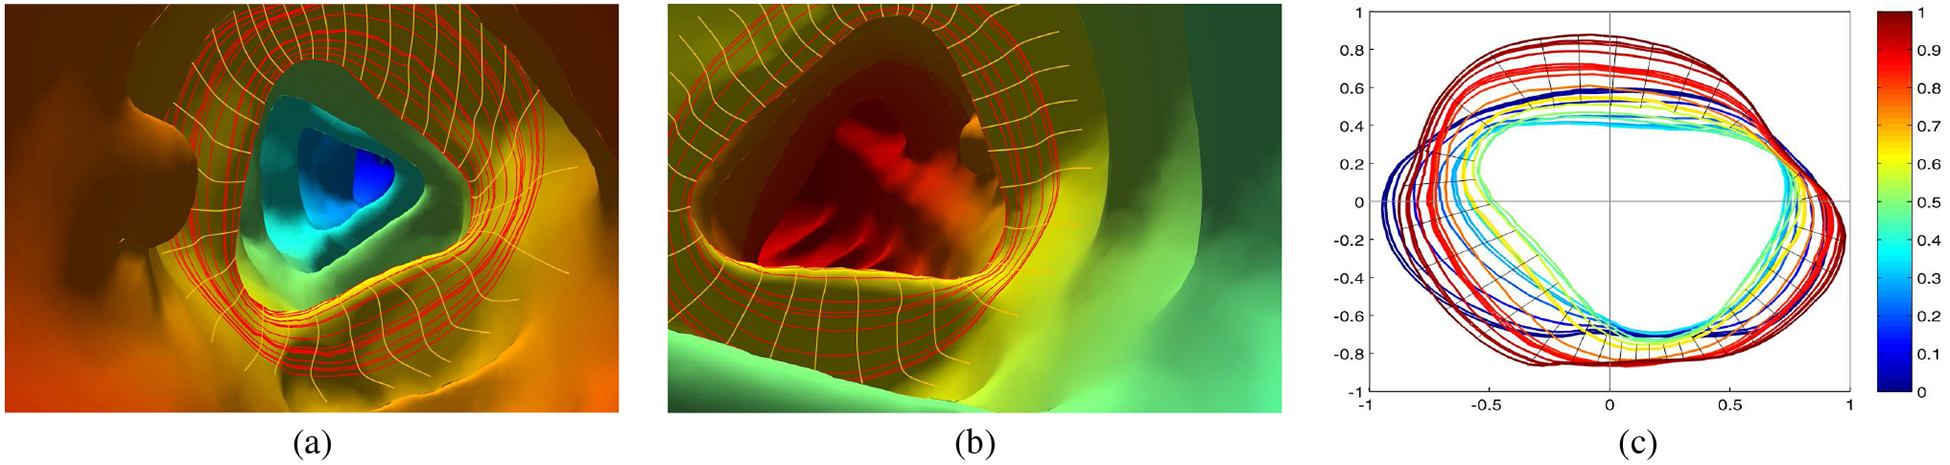
Haustral fold detection. (a) and (b) show two endoluminal views of the same colon segment with a 3D level set bundle (red loops) and corresponding cross curves (yellow lines). (c) Level sets projected on planes and normalized in 2D with the black lines representing the cross curves from an extreme level set in a bundle to the middle level set contour.