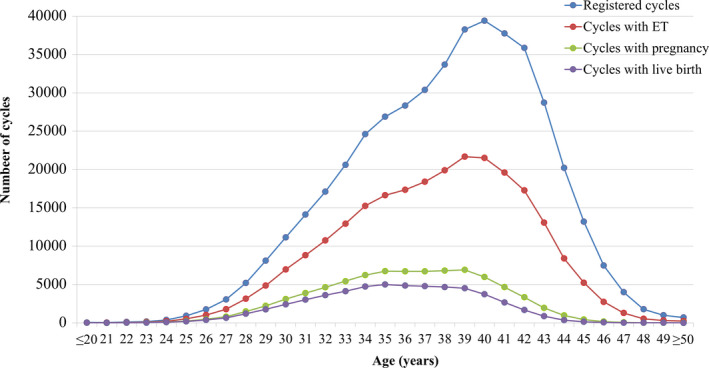
FIGURE 1.

Age distributions of all registered cycles, different subgroups of cycles for ET, pregnancy, and live birth in 2018. Adapted from the Japan Society of Obstetrics and Gynecology ART Databook 2018 (http://plaza.umin.ac.jp/~jsog‐art/2018data_20201001.pdf). ET, embryo transfer
