Figure 1.

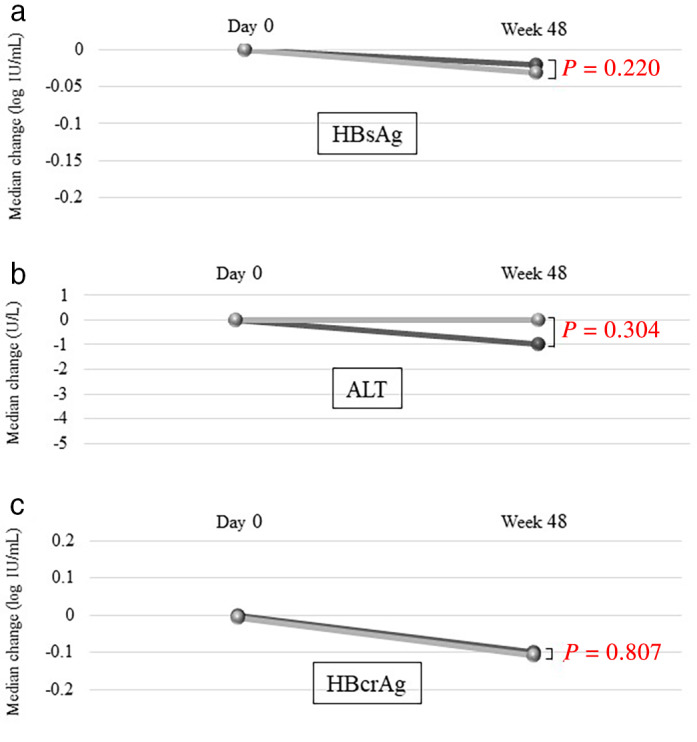
Comparison of treatment efficacies between the ETV‐TAF and ETV groups. The median changes in the (a) HBsAg levels: ( ), ETV‐TAF; (
 ), ETV; (b) ALT levels: (
 ), ETV‐TAF; (
 ), ETV, and (c) HBcrAg levels: (
 ), ETV‐TAF; (
 ), ETV. ALT, alanine aminotransferase; ETV, entecavir; HBcrAg, hepatitis B virus core‐related antigen; HBsAg, hepatitis B surface antigen; TAF, tenofovir alafenamide.
