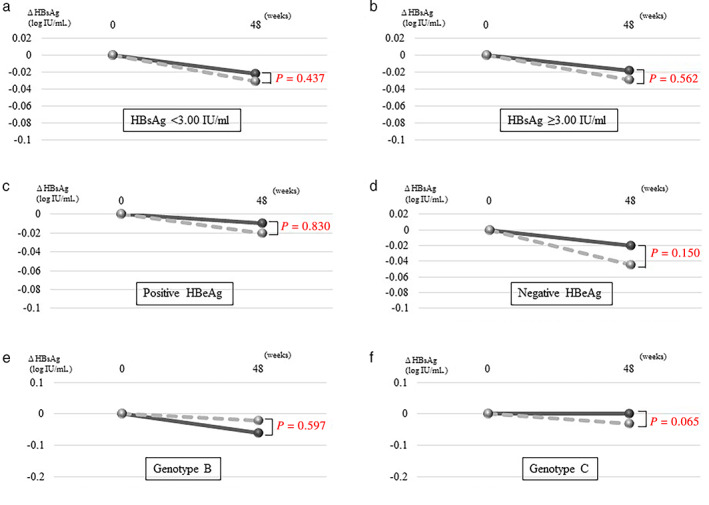
Figure 2.

Comparison of HBsAg reduction between the two subgroups according to the baseline factors in the ETV‐TAF and ETV groups. The median HBsAg changes in the subgroups with (a) HBsAg <3.00 log IU/mL: ( ), ETV‐TAF: HBsAg < 3.00 log IU/mL; (
 ), ETV: HBsAg < 3.00 log IU/mL, (b) HBsAg ≥3.00 log IU/mL: (
 ), ETV‐TAF: HBsAg ≥ 3.00 log IU/mL; (
 ), ETV: HBsAg ≥ 3.00 log IU/mL, (c) positive HBeAg: (
 ), ETV‐TAF: HBeAg positive; (
 ), ETV: HBeAg positive, (d) negative HBeAg: (
 ), ETV‐TAF: HBeAg negative; (
 ), ETV: HBeAg negative, (e) HBV genotype B: (
 ), ETV‐TAF: genotype B; (
 ), ETV: genotype B, and (f) HBV genotype C: (
 ), ETV‐TAF: genotype C; (
 ), ETV: genotype C. ETV, entecavir; HBeAg, hepatitis B envelope antigen; HBsAg, hepatitis B surface antigen; TAF, tenofovir alafenamide.
