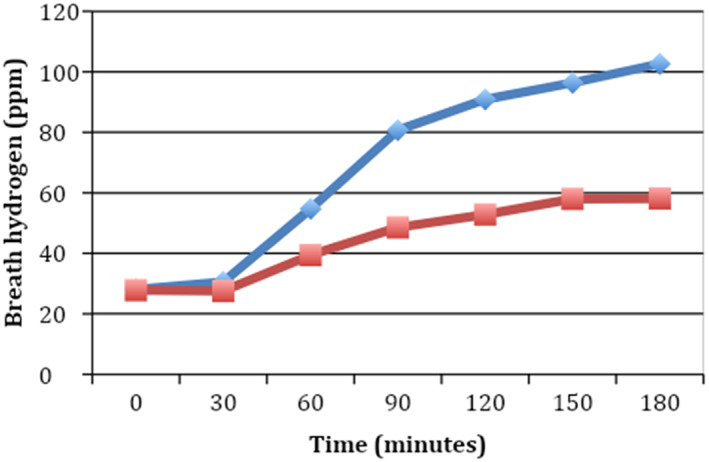
Figure 3.

Comparison of hydrogen breath levels between lactase and placebo groups after crossover analysis (n = 47).  , Placebo;
  , lactase.

Comparison of hydrogen breath levels between lactase and placebo groups after crossover analysis (n = 47).  , Placebo;
  , lactase.