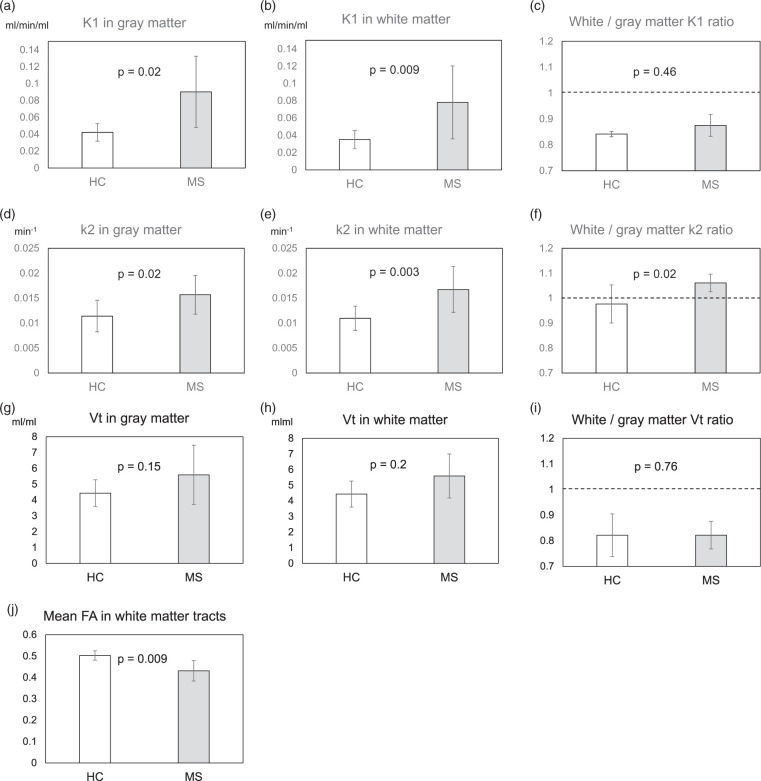
Figure 2.
1-C-11 acetate k2 parametric maps were constructed and anatomically normalized by using the density preserving warping method in SPM8. 1-C-11 acetate K1 (a, b, c), k2 (d, e, f), and Vt (g, h, i) were evaluated using grey matter (a, d, g) and/or white matter (b, e, h) binary masks based on automatically segmented MRI. Note: The white matter/gray matter K1 (C), k2 (F), and Vt (I) ratios were also evaluated in the NC and MS groups. The FA values (j) were assessed by applying the fiber tract-based atlas to the anatomically normalized individual FA images, as described in the text. Statistical comparisons between the two groups were performed by Mann-Whitney’s U test. The error bars indicate standard deviation.

