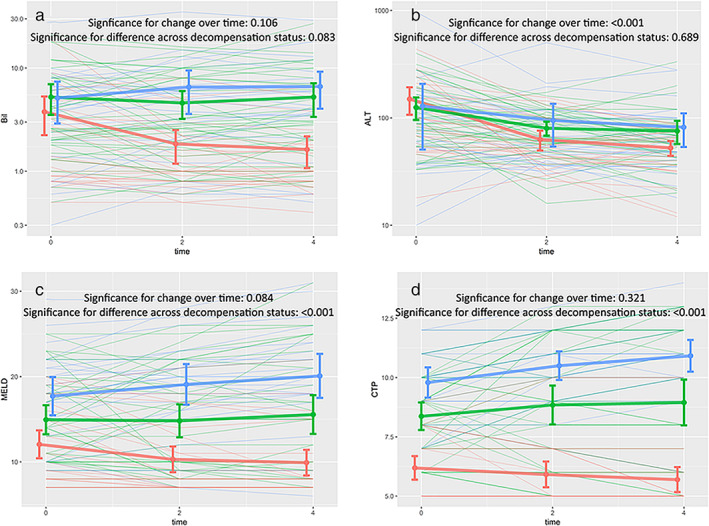
Figure 3.

Profile plots demonstrating change in (a) serum bilirubin, (b) serum alanine transaminase (ALT), (c) model for end‐stage liver disease (MELD), and (d) Child Turcot Pugh (CTP) scores over first month of treatment with steroids, in all the three strata at treatment initiation. Linear mixed effects models were used to compute significance of change across different strata and over time, shown with respective plots. Colors represent different strata, with thicker lines representing means of respective strata. Error bars represent standard deviation at that particular time point. Time on x‐axis is in weeks from initiation of treatment.  , Compensated;
  , no/mild ascites;
  , gross ascites.
