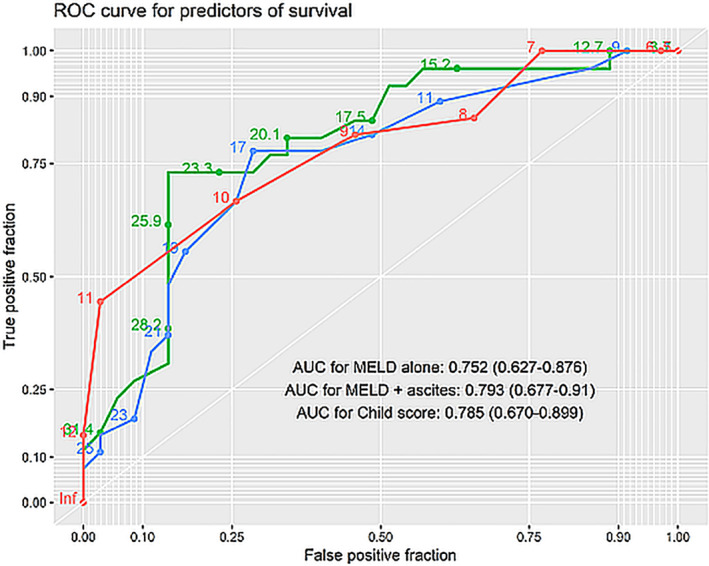
Figure 4.

Receiver operator characteristics (ROC) curves for predictors of survival. Numbers on plot represent value of respective prognostic variable. Area under curve for different indices are indicated in the plot along with their 95% confidence intervals.  , Child score;
  , model for end‐stage liver disease (MELD) + ascites;
  , MELD alone.
