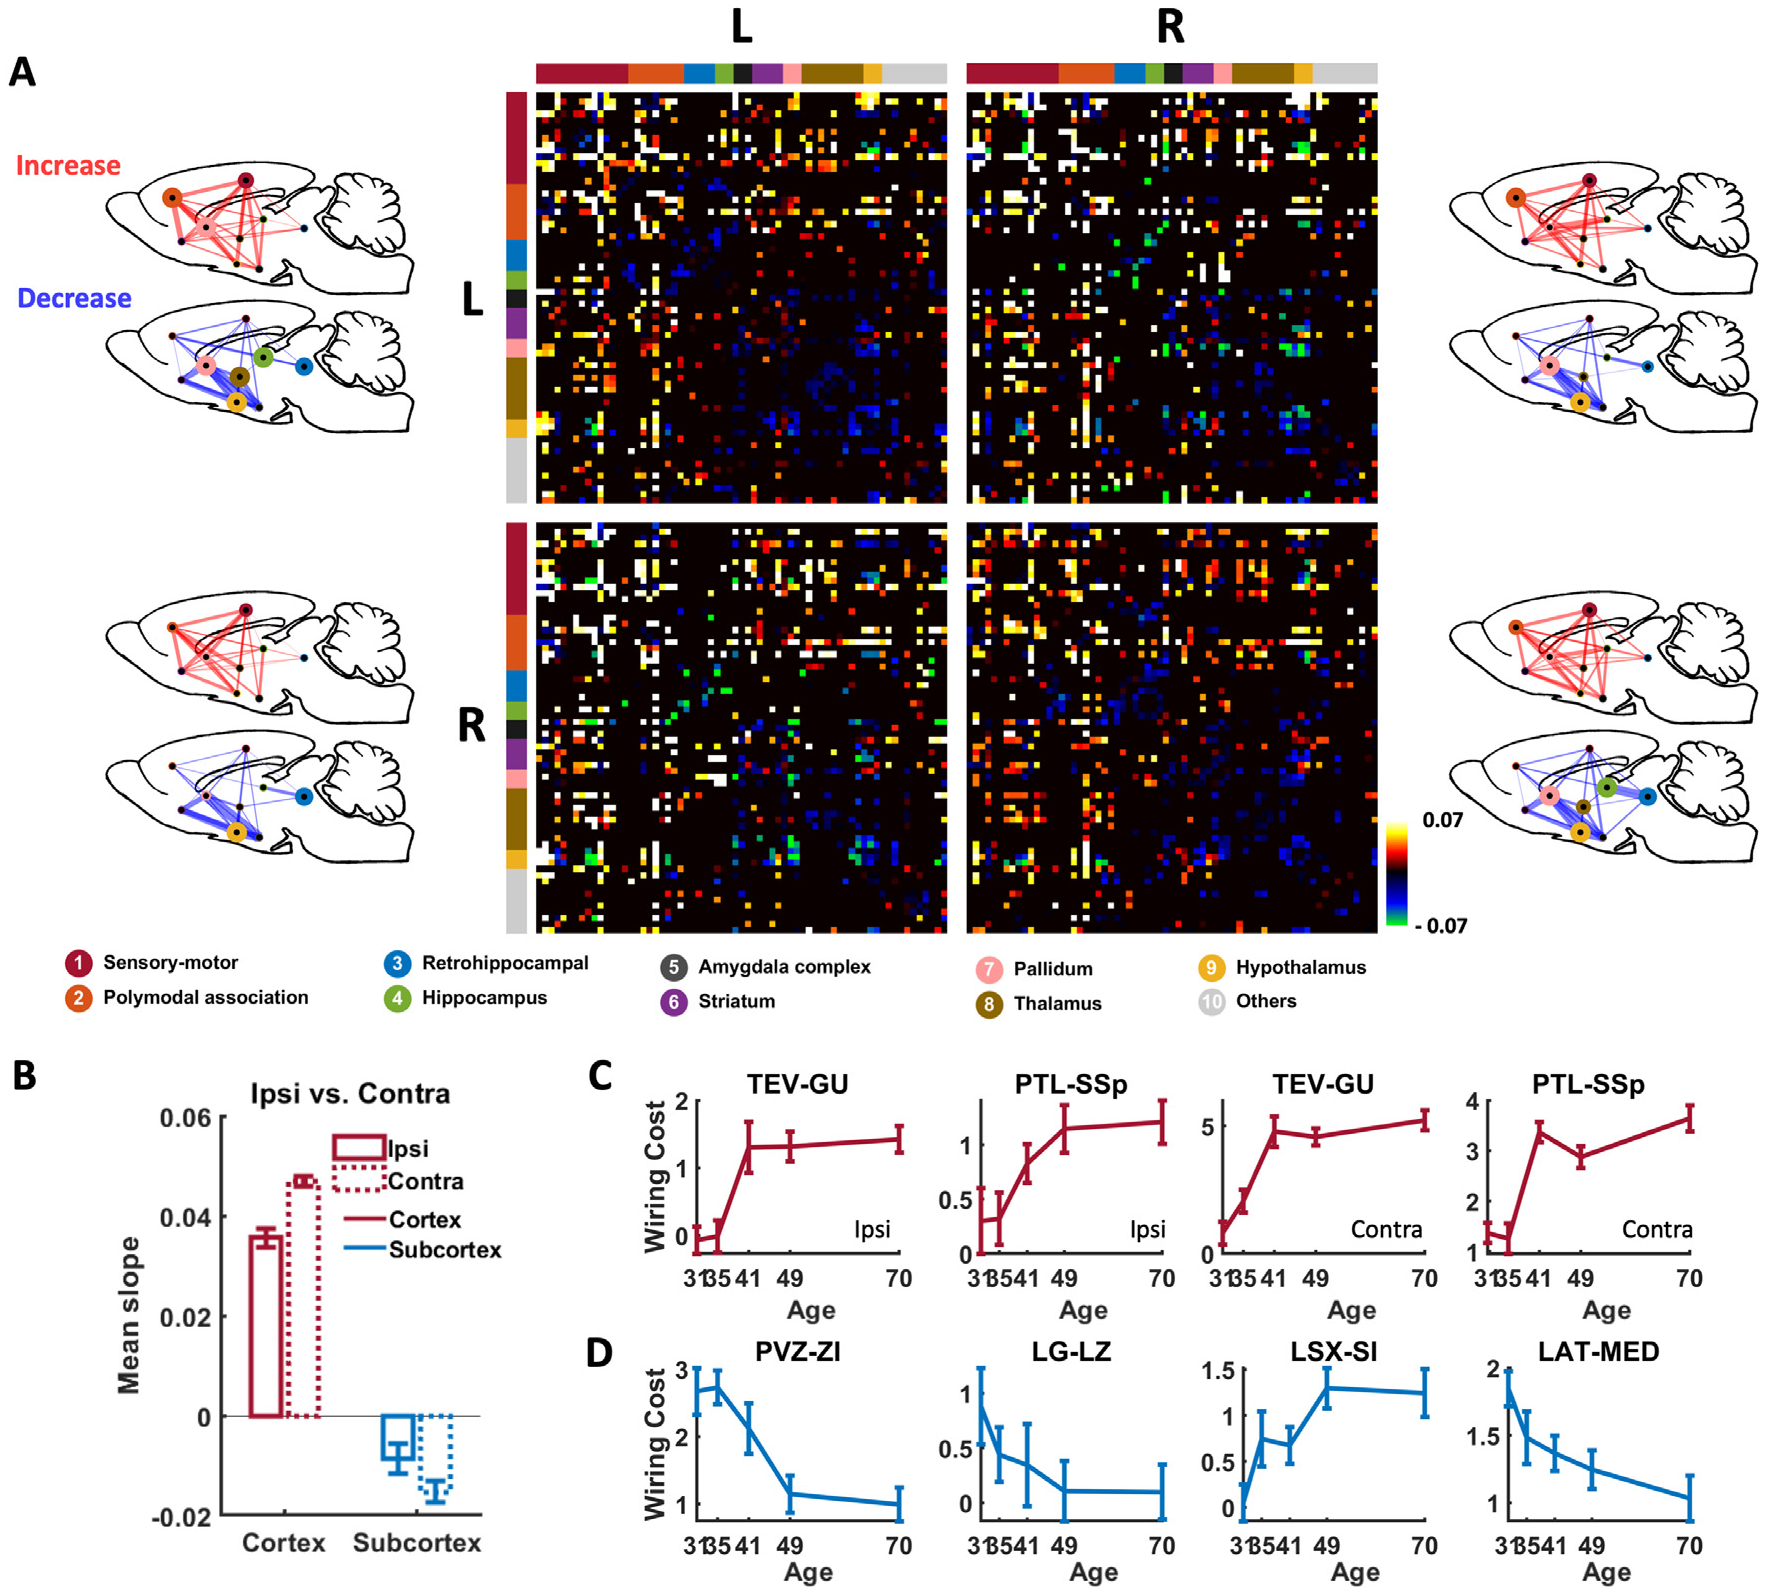
Fig. 3.

Developmental wiring cost changes for individual connections. (A) Connections exhibiting significant wiring cost change over age (mixed-effect one-way ANOVA, p < 0.01, Bonferroni corrected). Colors indicate the slope of linear regression of wiring cost against age. ROIs in the matrix were organized by left/right hemisphere and by 9 brain systems based on anatomical definition. Red: sensorimotor cortex; orange: polymodal association cortex; blue: retrohippocampus; green: hippocampus; black: amygdala complex; purple: striatum; pink: pallidum; brown: thalamus; yellow: hypothalamus; gray: all other ROIs. Wiring cost changes in each quadrant were overlaid on to a glass rat brain. Top left: Left to left hemisphere. Top right: Left to right hemisphere. Bottom left: Right to left hemisphere. Bottom right: Right to right hemisphere. The node size is proportional to the number of connections with significant wiring cost change normalized to the number of all possible connections within the system. The edge thickness is proportional to the number of connections with significant wiring cost change normalized to the number of all possible connections between the two systems. (B) Age-related change in wiring cost separately averaged from all cross-hemispheric connections and within-hemispheric connections in the cortex and subcortex, respectively. (C-D) Wiring cost trajectories in representative connections in the cortex (C) and subcortex (D). Bars: SEM.
