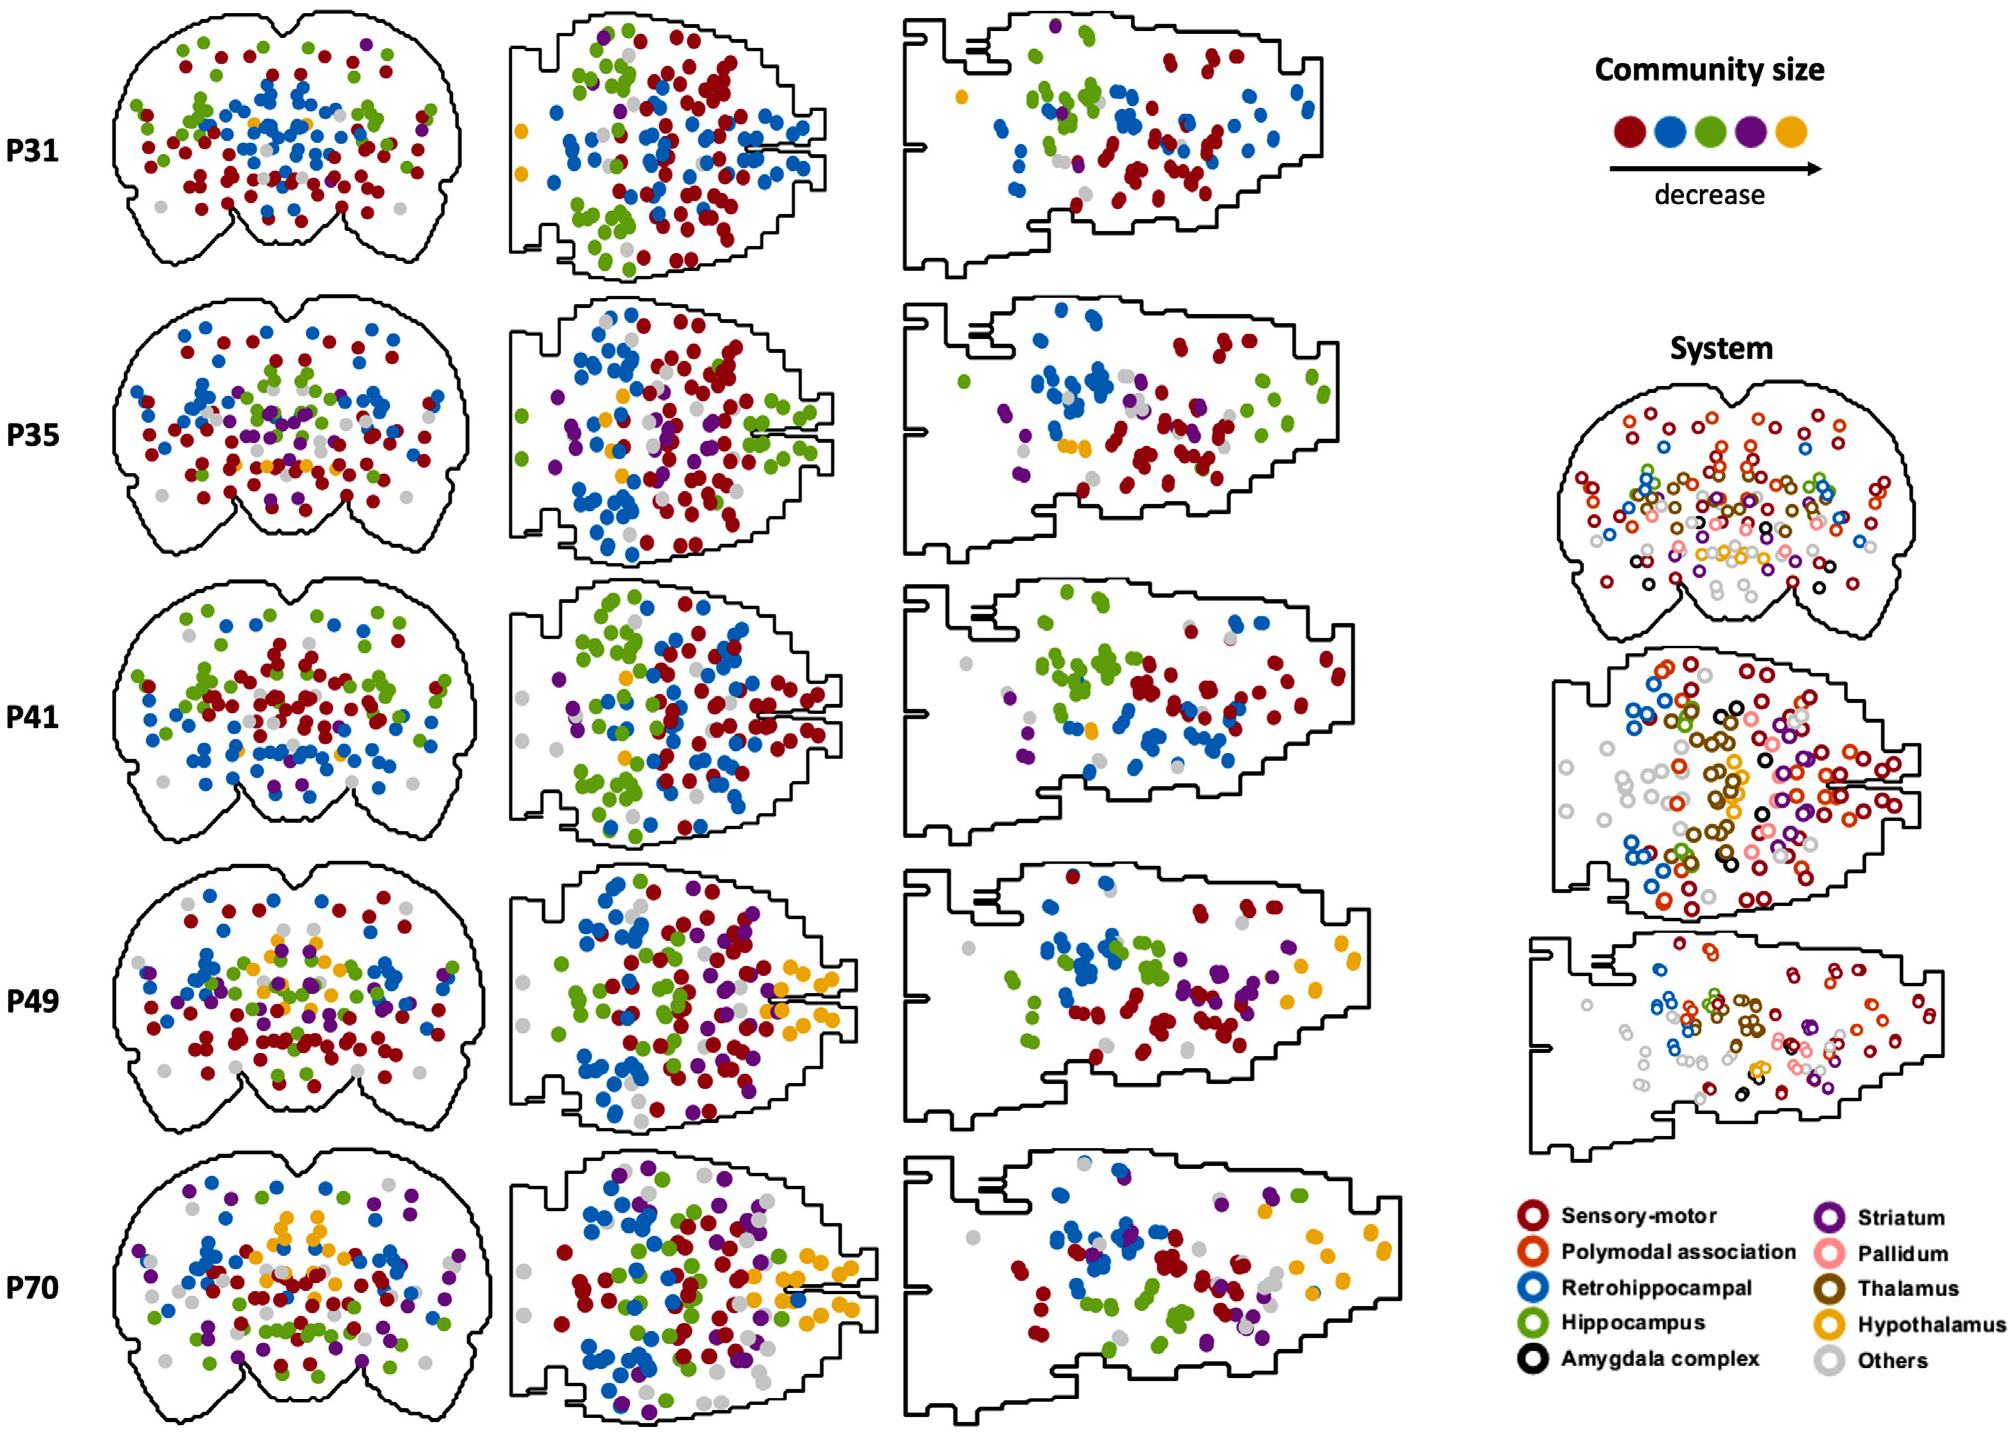
Fig. 7.

Community structure at each age (graph density = 0.15). Each dot represents one ROI. Left: solid dots represent the community structure. Dots with the same color belong to the same community, and the color indicates the community size. The largest 5 communities are displayed. Right: open circles represent the corresponding brain systems of ROIs.
