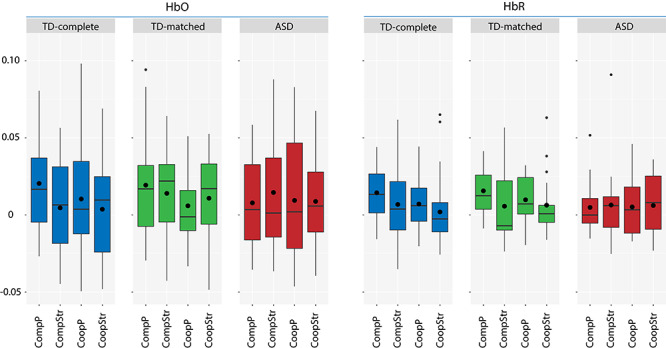
Fig. 3.

Differences between parent–child cooperation (CoopP), parent–child competition (CompP), stranger–child cooperation (CoopStr) and stranger–child competition (CompStr) in coherence, measured in HbO and HbR, for the TD-complete, TD-matched and ASD group. Boxplots are depicted. The lower and upper hinges correspond to the 25 and 75% percentiles. The lower and upper whiskers extend from the hinge to the lowest/largest values with a maximum of 1.5 times the inter-quartile range. The median value is represented by the horizontal bar and the mean by the black circle.
