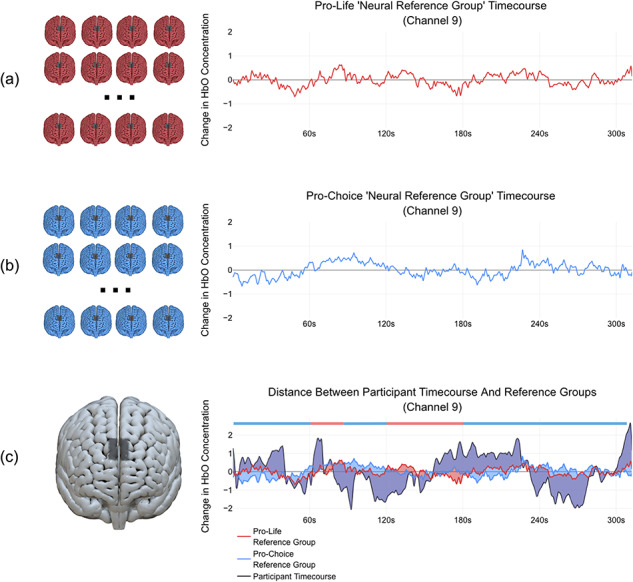
Fig. 2.

Depiction of the neural reference group classification approach. (a) Neural timecourses from channel 9 for participants holding a pro-life stance are averaged together to form a pro-life neural reference group timecourse. (b) Timecourses for participants holding a pro-choice stance are averaged together to form a pro-choice neural reference group timecourse. (c) A participant’s timecourse, whose data were not included in the reference group timecourses, is compared to the timecourses of the two neural reference groups. The participant is then categorized as belonging to one group or the other by demonstrating greater similarity with one group over the other, as measured by a distance metric (Euclidean distance in this case, though Pearson correlation might also be used). Areas that are shaded in purple demonstrate overlap where the participant‘s timecourse differed from both reference groups. Areas shaded blue or red correspond to where the participant’s timecourse diverged more from one of the reference groups (blue=diverging further from pro-choice, red=diverging further from pro-life). These red and blue areas are key to determining which reference group the participant differs from most in order to match the participant as being likely to belong to one group or the other. Blue and red bars shown above the graph indicate sections of the timecourse where the participant differed more than (i.e. had a greater Euclidean distance from) one group or the other. For the participant shown here, a larger blue area than red area across all timepoints indicates that the participant differed more from the pro-choice group, and thus this participant was classified as being pro-life. In future studies, it may be valuable to examine regions of the timecourse when most participants tend to show similarity to one group over the other and identify moments in the video to which those timepoints correspond.
