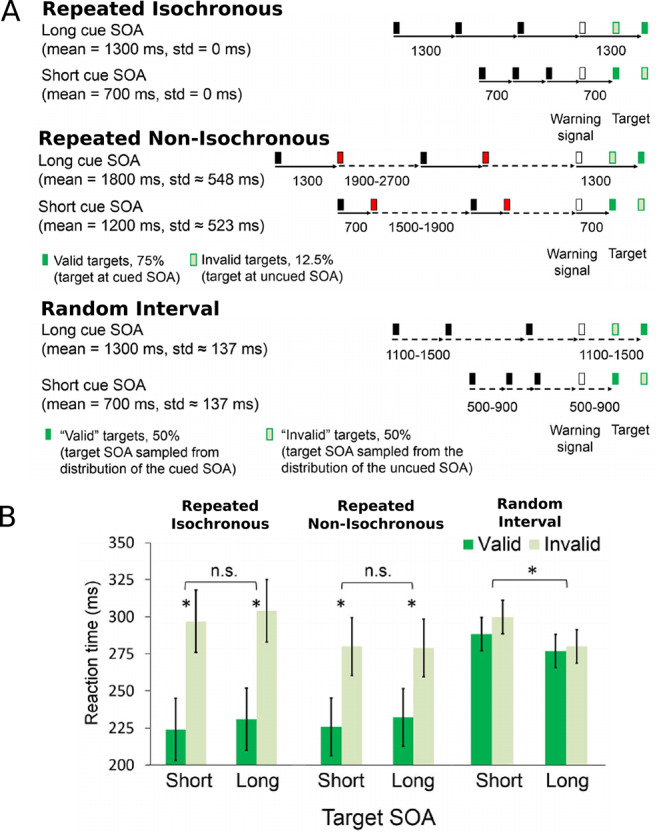
Fig. 1.

Breska and Deouell (2017) stimuli and results. (A) Subjects detected targets embedded in a stream of visual stimuli. In the repeated isochronous condition, the stream of intervals was fixed. In the repeated non-isochronous condition, every black-to-red interval was fixed and red-to-black intervals were jittered. In the random interval condition, all intervals were jittered around the fixed interval. In the first two conditions, the target (dark green) appeared at the fixed SOA relative to a warning signal (white) in 75% of the trials and at the other SOA in 12.5% of the trials (light green with dark green edge). The remaining 12.5% were catch trials in which no target appeared, to prevent anticipatory responses to long SOA targets. In the random interval condition, the target SOA was drawn from the same distribution as the stream SOA in 43.75% of the trials and from the other distribution in the other 43.75%; again, 12.5% of the trials were catch trials. (B) Mean reaction times for each combination of SOA and cue validity in the three experimental conditions. Error bars represent standard errors of the validity effect within each SOA and condition. *P < 0.05.
