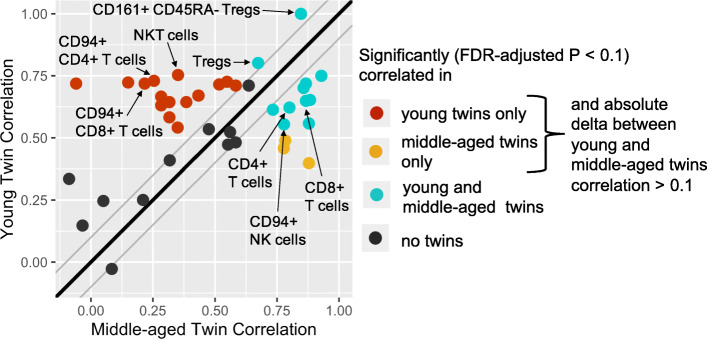
Fig. 1.
Spearman’s rank correlation (medians of random repeats; see methods) of cell frequencies for young (n = 14 pairs) vs. middle-aged (n = 9 pairs) twins. Each dot represents one cell type, colored by the significance of that correlation in the younger and middle-aged twin pairs. Black dots denote if no significant correlation was found in either young or middle-aged twins. The thick black line represents values at which the young and middle-aged twins have the exact same Spearman’s rank correlation. The upper and lower thin gray lines represent boundaries 0.1 above and below the thick black line

