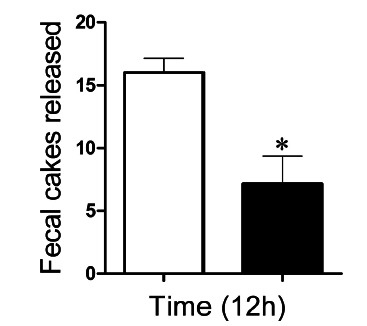
FIGURE 3. Number of fecal boluses eliminated by animals submitted to the Parkinson’s disease induction model during 12 h. The white bar (□) represents the number of fecal boluses eliminated by the animals in the control group (NaCl, 0.9%) and the black bars (■) represent the experimental group (6-OHDA).

