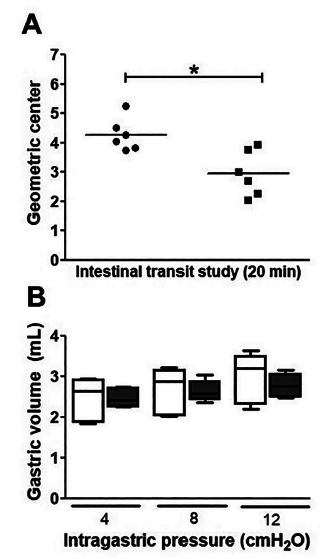
FIGURE 4. Assessment of intestinal transit and gastric compliance: A) Geometric center of the test meal 20 min postprandial, where the circles (●) represent the average retention values of the test meal in the gastrointestinal tract of animals in the control group and the squares (■) represent the experimental group (6-OHDA); B) gastric volume of animals at different intragastric pressures (4, 8 and 12 cmH2O). The white boxes (□) represent the animals in the control group (NaCl, 0.9%) and the black boxes (■) represent the experimental group (6-OHDA). The horizontal, lower and upper lines represent the median, lowest and highest values obtained, respectively, during 10 min of monitoring.

