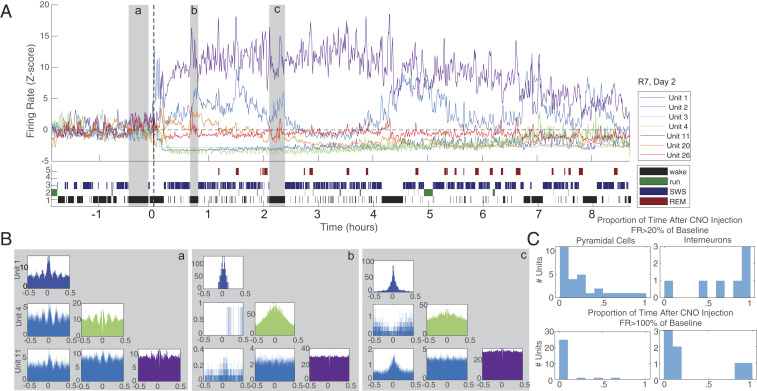
Fig. 3.
Time-varied CA1 interneuron response to CNO injection. (A, Top) Z-scored firing rate (calculated in 60-s windows at 30-s steps) of all seven interneurons from a single session (subject 7, session 2). Note that some interneurons increase their firing rate while others are silenced. Unit numbers are indicated in the legend. (A, Bottom) State scoring for this session with states indicated in the legend. (B) Interneuron auto- and cross-correlograms from selected epochs. In this case, three wake epochs were chosen (shaded in gray, labeled with lowercase letters). Epoch a, baseline, before injection of CNO + DMSO. Epochs b and c, approximately 1 and 2 h after injection. Note the altered cross-correlations between neuron pairs following drug injection. (C) Histograms quantifying return to baseline after injection of CNO + DMSO for the above session. Proportion of time following injection during which each cell firing rate was >20% of baseline firing rate (Top) and >100% of baseline FR is plotted. Pyramidal cells (Left) reliably spend very little time in recovery following CNO + DMSO injection. Interneurons (Right) reflect a mixed picture, with some spending varying epochs above, and others below, baseline.

