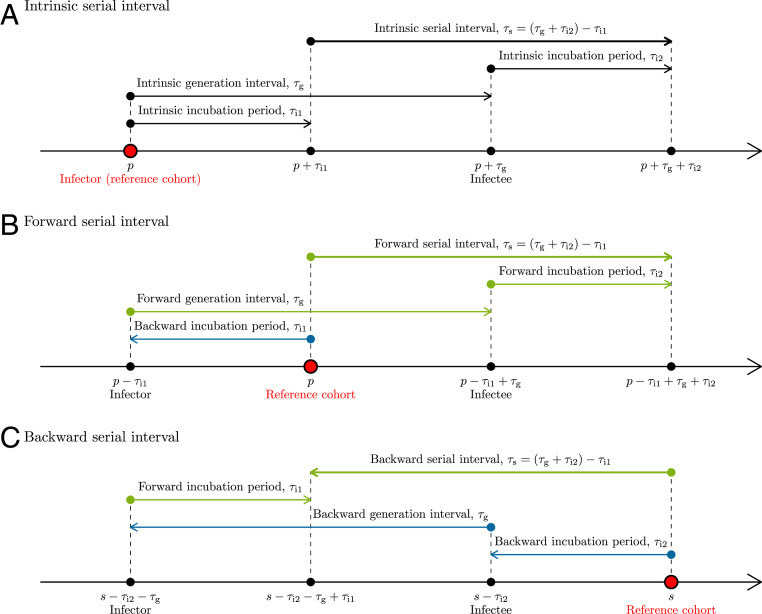
Fig. 1.
Illustration of intrinsic, forward, and backward serial intervals. (A) The intrinsic serial interval for a cohort of individuals infected at time . In this case, is drawn from the intrinsic incubation period distribution, is drawn from the intrinsic generation interval distribution, and is drawn from the intrinsic incubation period distribution. (B) The forward serial interval for a cohort of infectors who became symptomatic at time . In this case, is drawn from the backward incubation period distribution, is drawn from the forward generation interval distribution, and is drawn from the forward incubation period distribution. (C) The backward serial interval for a cohort of infectees who became symptomatic at time s. In this case, is drawn from the forward incubation period distribution, is drawn from the backward generation interval distribution, and is drawn from the backward incubation period distribution. Intrinsic intervals (black) reflect average of individual characteristics and are not dependent on population-level dynamics. Forward intervals (green) can change due to epidemiological dynamics (e.g., contraction of generation intervals through susceptible depletion). Backward intervals (blue) can change due to changes in cohort sizes even when forward intervals remain time invariant.

