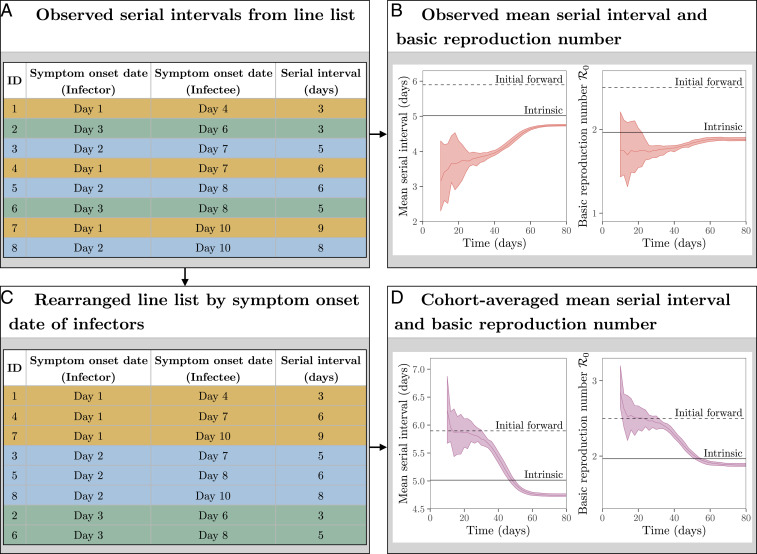
Fig. 4.
Estimating the reproduction number from the observed serial intervals. (A) Schematic representation of line list data collected during an epidemic. (B) Estimates of based on all observed serial intervals completed by a given time. (C) Schematic representation of line list data rearranged by symptom onset date of infectors. (D) Estimates of based on all observed serial intervals started by a given time. Black dashed lines represent the mean initial forward serial interval and . Black solid lines represent the mean intrinsic serial interval and . Colored solid lines represent the mean estimates of across 10 stochastic simulations. Colored ribbons represent the range of estimates of across 10 stochastic simulations.

