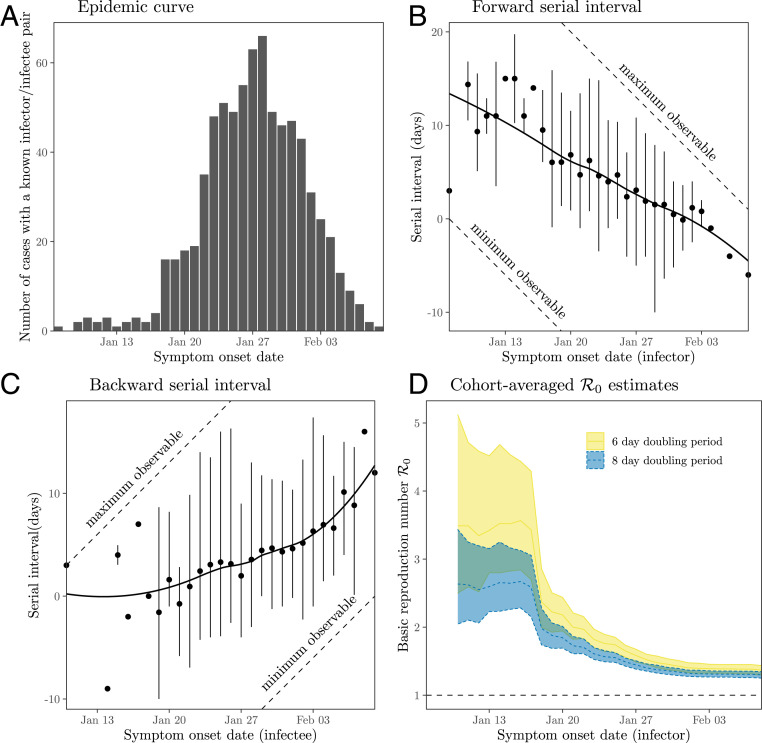
Fig. 5.
Observed serial intervals of COVID-19 and cohort-averaged estimates of . (A) Symptom onset dates of all individuals within 468 transmission pairs included in the contact tracing data. (B and C) Forward and backward serial intervals over time. Serial interval data have been grouped based on the symptom onset dates of primary (B) and secondary (C) cases. Points represent the means. Vertical error bars represent the 95% equitailed quantiles. Solid lines represent the estimated locally estimated scatterplot smoothing fits. The dashed lines represent the maximum and minimum observable delays across the range of reported symptom onset dates. (D) Cohort-averaged estimates of assuming doubling period of 6 and 8 d (14, 39). Ribbons represent the associated 95% bootstrap CIs. The data were taken from supplementary materials of ref. 13.

