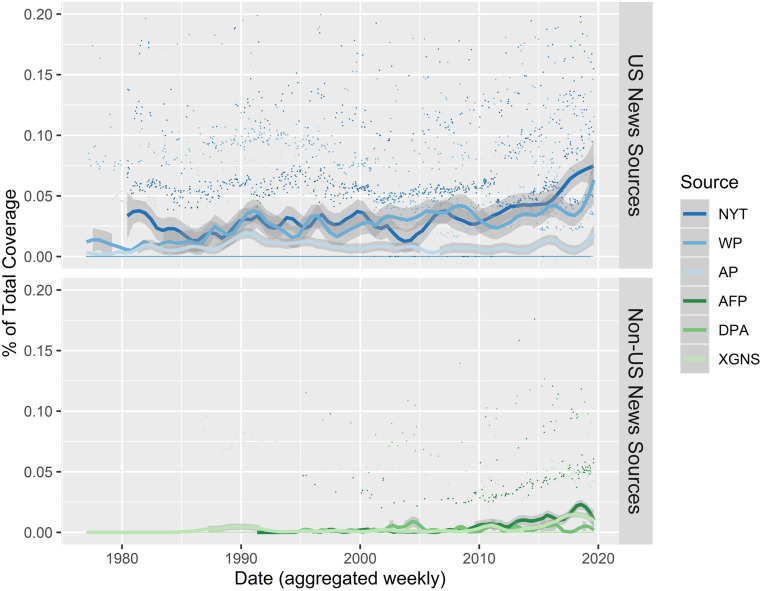
Fig. 2.
Levels of attention to pollinator populations in both US and non-US news sources from 1977 to 2019 across nearly 25 million news reports, shown as the percentage of total weekly news output in each source that mentions pollinator population terms. Blue lines are US news sources; green lines are non-US news sources. Note that, in contrast to Fig. 1, the y axis runs from 0.0 to 0.2 percentage points of total coverage. If the trends in this figure were overlaid on Fig. 1’s more expansive y axis, the result would appear to be a darkened cluster of lines slightly above the zero point for all decades.

