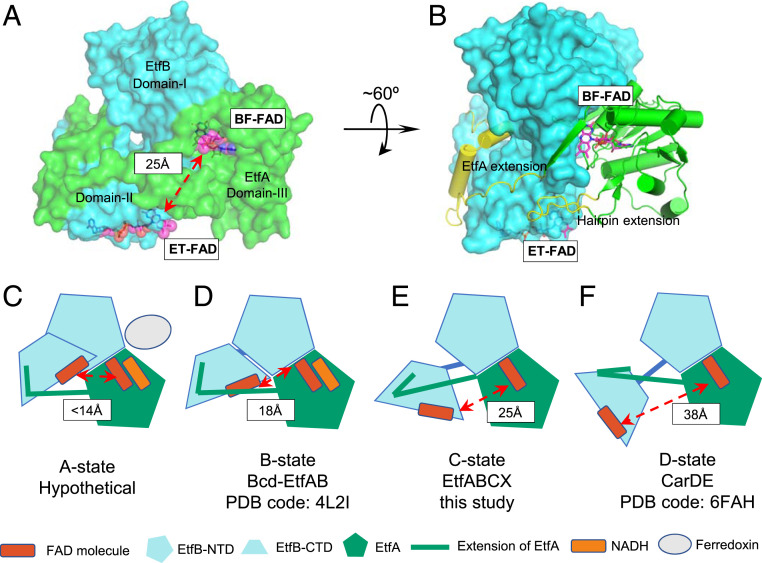
Fig. 3.
Distance between the BF-FAD and EF-FAD varies due to the movement of the EF-FAD–containing EtfB C-terminal domain (CTD). (A) Tma EtfAB is shown in surface representation with the bound FADs in magenta sticks and spheres. EtfA and EtfB are in green and cyan, respectively. (B) EtfA is shown in cartoon representation. Regions that deviate >2 Å (Cα distance) from B-state EtfAB (PDB ID code 4L2I) are highlighted in yellow, revealing a large conformational change from the B state. (C–F) Sketches showing the relative CTD of Tma EtfB in a unique C state (E), as compared with a hypothetical A state where the electron transfer can happen between two FADs (C), EftAB-Bcd (butyryl-CoA dehydrogenase; PDB ID code 4L2I) in the B state (D), and CarDE (caffeyl-CoA reductase; PDB ID code 6FAH) in the D state (E). The three structures (D–F) were aligned based on the EtfB N-terminal domain (NTD) and EtfA.

