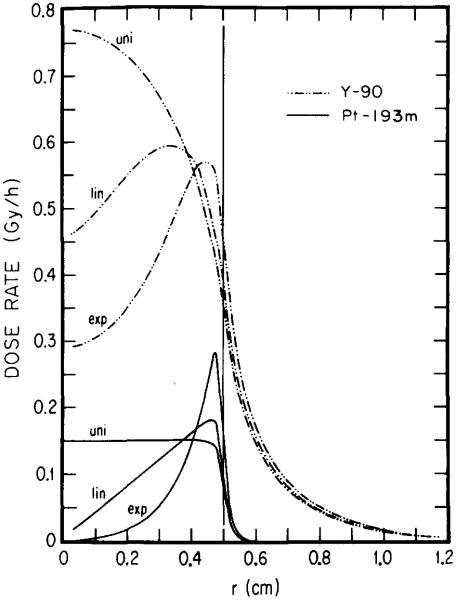
Fig. 2.
Dose rate profile for 90Y and 193mPt as a function of the radial coordinate r. Each radionuclide (1 MBq) is assumed to be localized uniformly (uni), linearly (lin), and exponentially (exp) in a tumor of 0.5-cm radius. Substantial tailing of the 90Y dose rate into healthy tissue regions (to the right of the vertical line at r = 0.5 cm) may be noted.

