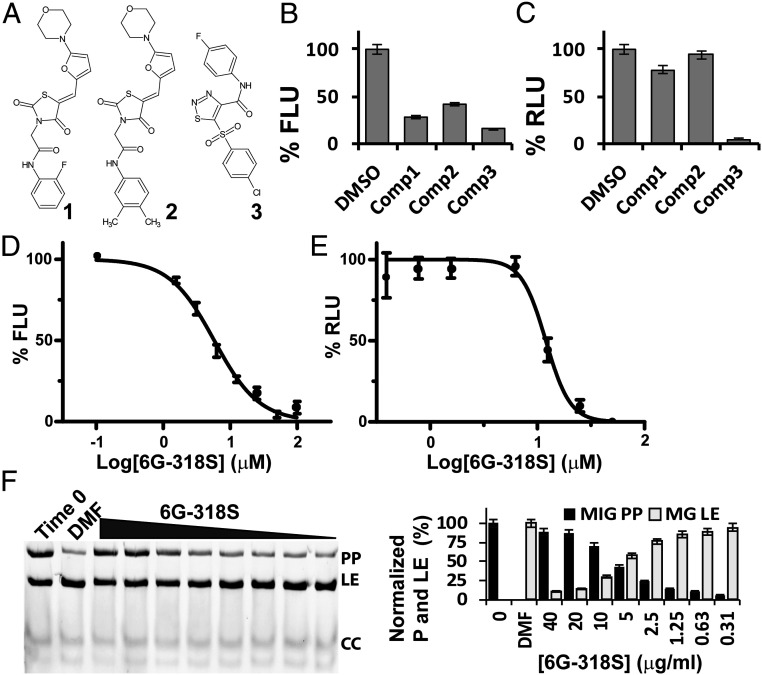
Fig. 2.
Pilot screening reveals a strong intein inhibitor. (A) Chemical structures of hit compounds. (B) Inhibition of split-GFP–Prp8 splicing by hit compounds at 20-µM concentration. (C) Inhibition of the split RLuc–Prp8 intein splicing by hit compounds at 20 µM concentration. (D and E) Dose-dependent inhibition of the split-GFP–Prp8i (200 nM) and RLuc–Prp8 (2 nM) intein splicing by 6G-318S, which was in twofold serial dilutions with concentrations ranging from 100 µM to 0.78 µM. n = 3. (F) Dose-dependent inhibition of MIG–Prp8 splicing by 6G-318S. (Left) SDS/PAGE analysis of each sample; (Right) relative percentage reduction of the MIG precursor upon treatment, compared to the starting material (T0). %P decrease is calculated as (%PT0 − %PSample)/(%PT0 − %PDMF) × 100, where %P indicates percent of the MIG precursor at time point 0 (PT0) and/or after ∼18 h of treatment with DMF (PDMF) or 6G-318S at different concentrations (PSample). n = 3.

