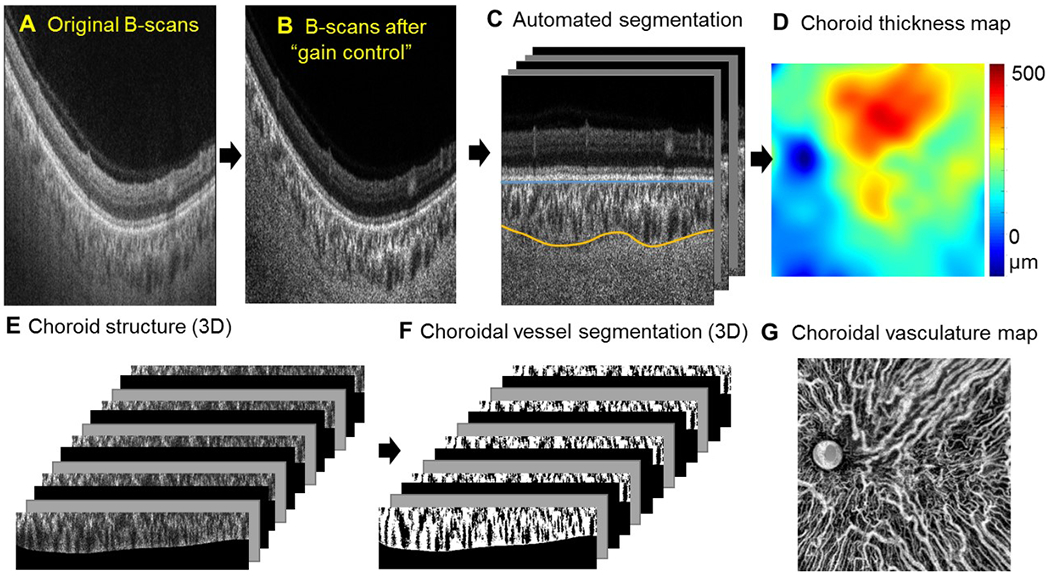
Figure 1.

Flow chart for automatic assessment of choroid thickness and the choroidal vasculature. Signals in the regular OCT B-scans (A) were converted to enhanced signals with attenuation correction (B). (C) Automatic segmentation of choroid slab. The Bruch’s membrane (blue line) and outer boundaries of the choroidal vessels (yellow line) were detected through graph search methods. (D) En face choroidal thickness map. (E, F) Choroidal vessels were segmented in the whole volume and were presented as an en face choroidal vasculature map (G).
