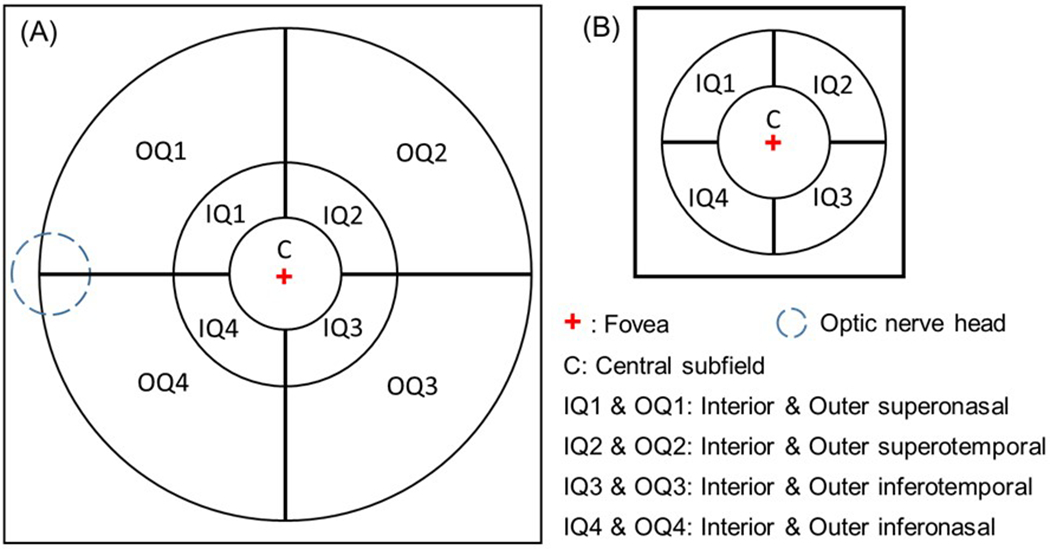
Figure 2.

Regional analysis of choroidal thickness and vessel volume using a grid centered on the fovea. (A) The grid used for the 12×12 mm scans was divided into 9 regions using 2.5 mm, 5 mm, 11 mm circles with horizontal and vertical lines added outside the 2.5 mm circle to divide the 5 mm and 11mm circles into quadrants. (B) The grid used for the 6×6 mm scans was divided into 5 regions using 2.5 mm and 5 mm circles with horizontal and vertical lines added outside the 2.5 mm circle to divide the 5 mm circle into quadrants.
