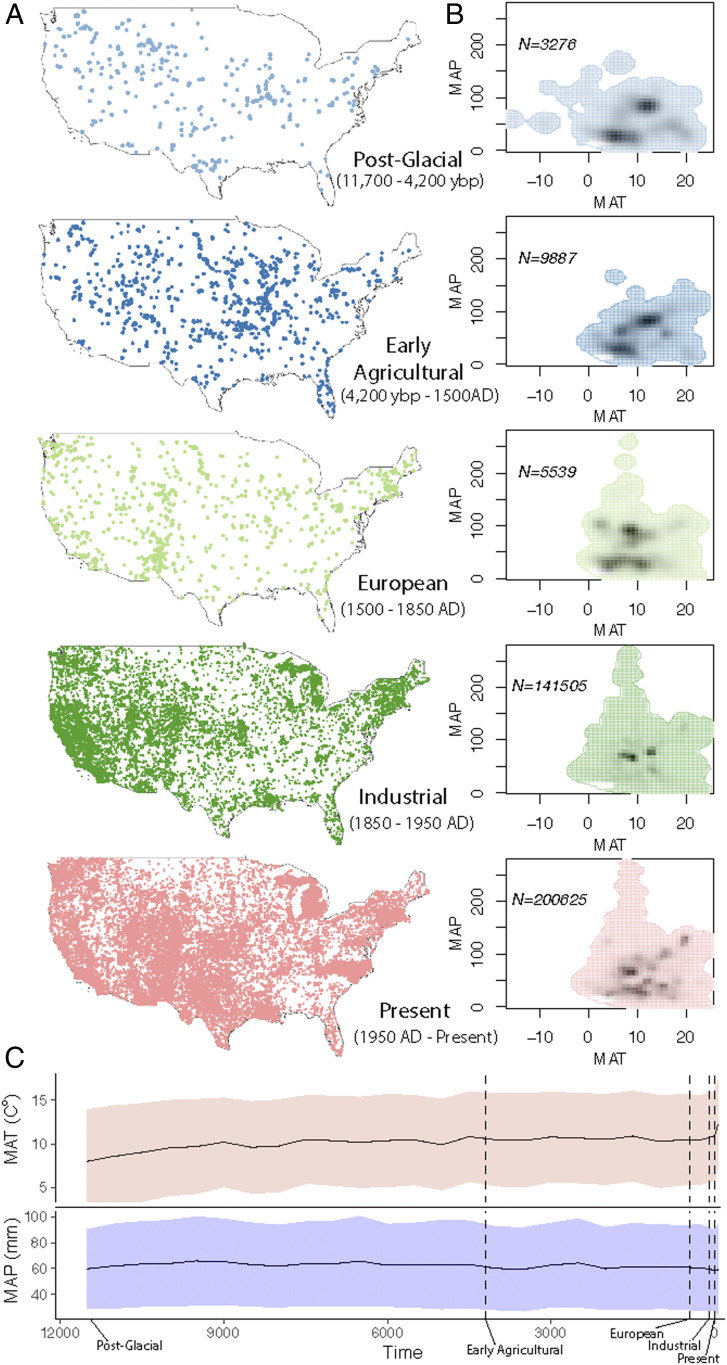
Fig. 1.
Study data. (A) Geographical distribution of the individual species occurrences for the 46 species in the study and for five different time intervals (16). (B) Available niche for each time interval based on the MAT and MAP of all the occurrence data points. Colors represent the available background niche and shading represents the relative density of species in a particular MAT and MAP combination. N indicates number of occurrences. (C) MAT and MAP across the studied time interval from 11,700 ybp to the present for the contiguous United States. Black lines indicate average value from the background data for every 500 y (Materials and Methods). Shaded areas represent SD from the same data.

