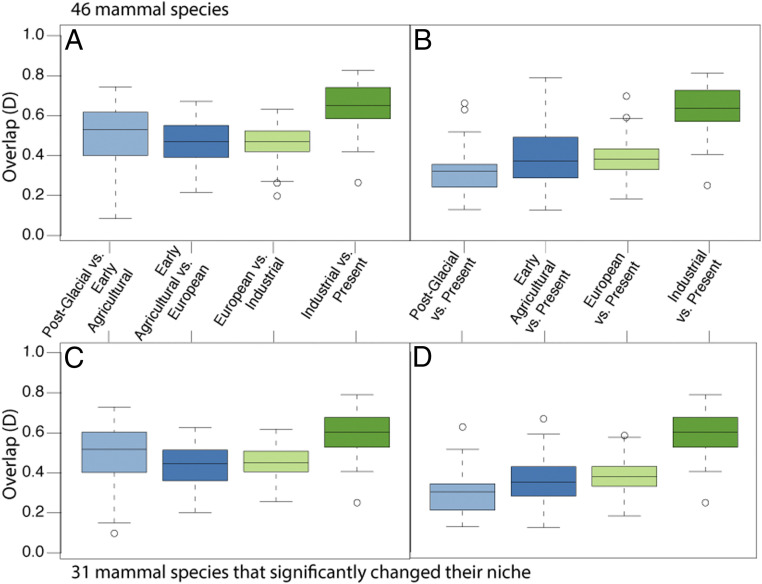
Fig. 2.
Boxplot of the overlap between different time intervals for the 46 mammal species in the study (A and B) and 31 mammal species that significantly changed their niche after the Industrial Revolution in North America (C and D). Overlap is calculated between subsequent time intervals (A and C) and for each time interval compared with the present (B and D). Overlap is average overlap from 100 subsampling iterations as described in Materials and Methods.

