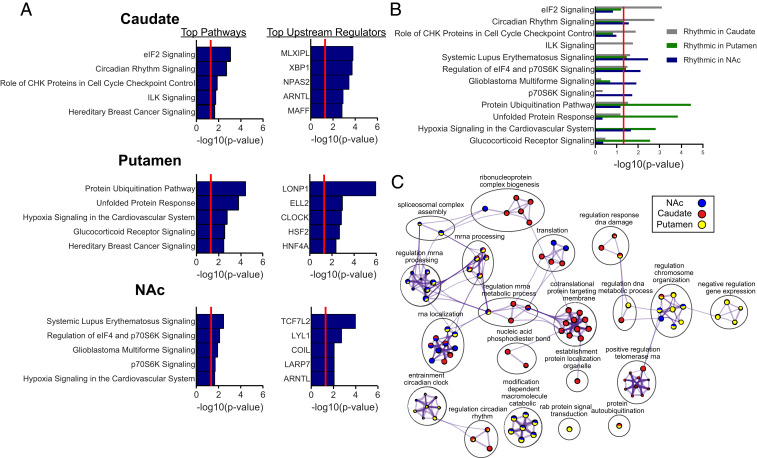
Fig. 3.
Pathway and biological process enrichment for rhythmic transcripts in the NAc, caudate, and putamen. (A) Top five pathways and upstream regulators enriched for rhythmic transcripts in each striatal region (Dataset S4 provides a complete list of pathways and upstream regulators). A significance threshold of P < 0.01 (NAc, 1,344 transcripts; caudate, 1,053 transcripts; putamen, 3,097 transcripts) was used to determine rhythmicity for the transcript input list. The significance threshold for pathway and upstream regulator enrichment is P < 0.05 [−log10(P value) > 1.3 in plots]. (B) Pathway enrichment for all three regions shown on the same plot, revealing both distinct and overlapping pathway enrichment between regions. (C) GO biological process enrichment via Metascape for the top 1,000 rhythmic transcripts in each region. Meta-analysis was used to compare process enrichment across striatal regions, depicted in the Cytoscape network plots. Terms with P < 0.01, a minimum count of 3, and enrichment factor >1.5 were grouped into clusters based on their membership similarities. The most statistically significant term within a cluster was chosen to represent the cluster. The top 10 significant terms were chosen for visualization (Dataset S5 provides a complete list of all enriched processes within each cluster). The nodes are represented as pie charts, where the size of the pie is proportional to the total number of gene hits for that specific term. The pie charts are color-coded based on the identity of the gene list, where the size of the slice represents the percentage of transcripts enriched for each corresponding term. Similar terms (kappa score >0.3) are connected by edges.

