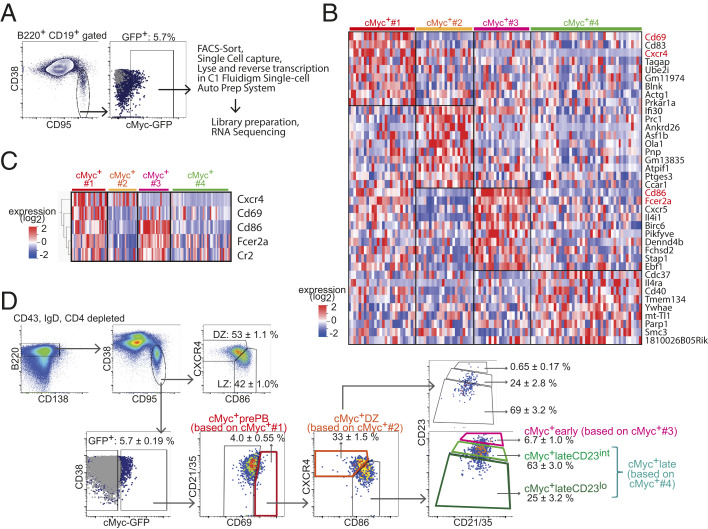
Fig. 1.
Identification and flow cytometric delineation of positively selected cMyc+ GC B cell subpopulations. (A) scRNAseq workflow and gating strategy for isolating splenic cMyc+ GC B cells of cMycgfp/gfp mice. (B) Heat map illustrating highly representative DEGs in each cluster. These DEGs passed thresholds: first, the cutoff for P ≤ 0.05 by multigroup comparison and second, for P ≤ 0.05 by two-group comparison (the cluster vs. ≠ the cluster) and log2 fold change >1. Fcer2a was the eighth enriched gene in the cMyc+#1 cluster, but it is not listed in the cluster because it is shown as the second enriched gene in the cMyc+#3 cluster instead. Genes encoding key markers that are used for delineating flow cytometric cMyc+ GC B cell subpopulations (as described in D) are highlighted in red. (C) Heat map illustrating the five key marker genes used in D. The markers were selected from 76 DEGs (P ≤ 0.005, by multigroup comparison). (D) Representative flow cytometry plots illustrating gating strategy to delineate cMyc+ GC B cell subpopulations. Splenic GC B cells of C57BL/6 mice are shown in gray dots as cMyc-GFPneg control cells. Average ± SEM value (15 mice) is shown in each indicated gate. Splenic GC B cell response to SRBC on day 7 in cMycgfp/gfp mice.

