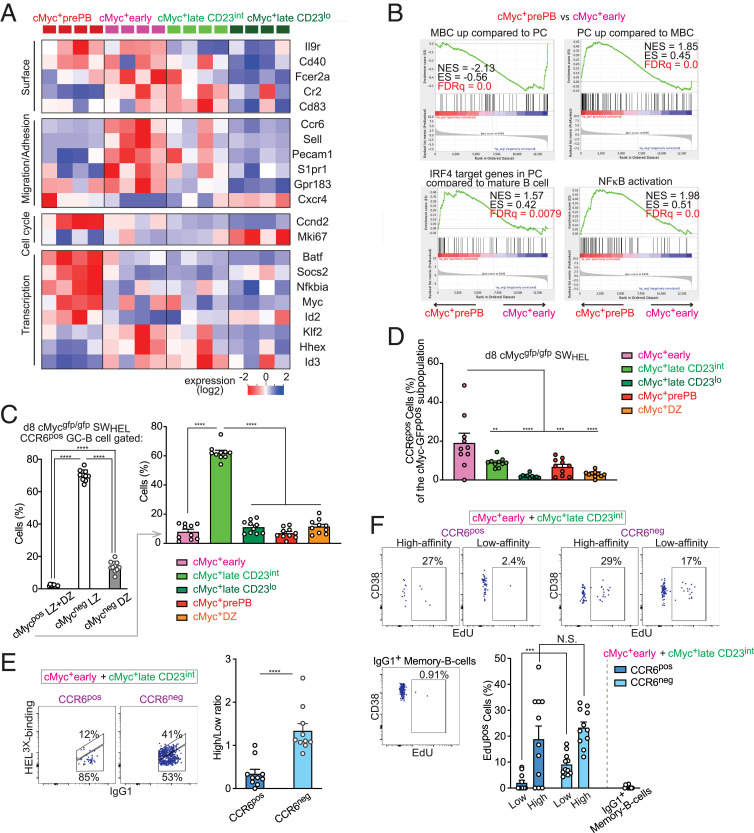
Fig. 6.
Specific cMyc+ GC B cell subpopulations contain MBC and PB/PC precursors. (A) Heat map for selected genes known to be associated with PB/PC or MBC differentiation. Only genes that have passed the threshold of P ≤ 0.04 by multigroup comparison are shown. (B) GSEA of differential gene expression in the cMyc+prePB subpopulation vs. the cMyc+early subpopulation for gene sets: “up-regulated in MBC compared with PC,” “up-regulated in PC compared with MBC,” “IRF4 target in PC compared with mature B cell,” and “NFκB activation.” Nominal enrichment score (NES), enrichment score (ES) and false discovery rate (FDR) q values. (C) Percentages of cells within the indicated populations after gating on CCR6pos GC B cells as shown in SI Appendix, Fig. S5C (Left). Percentage of cells within the cMyc+ GC B cell subpopulations after gating on CCR6pos cMyc+ GC B cells (Right). (D) Percentage of CCR6pos cells in the cMyc+ GC B cell subpopulations after gating as shown in SI Appendix, Fig. S5C. (E) Representative flow cytometric plots of HEL3× binding vs. IgG1 expression in CCR6pos and CCR6neg cells of the cMyc+early and cMyc+lateCD23int combined populations (Left). IgG1pos high-/low-HEL3× binding ratio in the indicated cell populations as gated in Left (Right). (F) Representative flow cytometric plots of CD38 vs. EdU incorporation in CCR6pos and CCR6neg cells of the cMyc+early and cMyc+lateCD23int combined populations that were further divided based on the BCR affinity as shown in E and IgG1pos MBCs 6 h after intravenous injection with EdU. Percentages of EdUpos cells in the indicated cell populations (Lower Right). SWHEL cMycgfp/gfp donor B cells on day 8 (C–E) or day 7 (F) after HEL3×-SRBC immunization. Pooled data from two experiments with 10 mice (C–E) or 11 mice (F). Error bars indicate SEM. Statistics were calculated with one-way ANOVA (C and D) or unpaired Student’s t test (E and F). N.S., not significant. **P < 0.01; ***P < 0.001; ****P < 0.0001.

