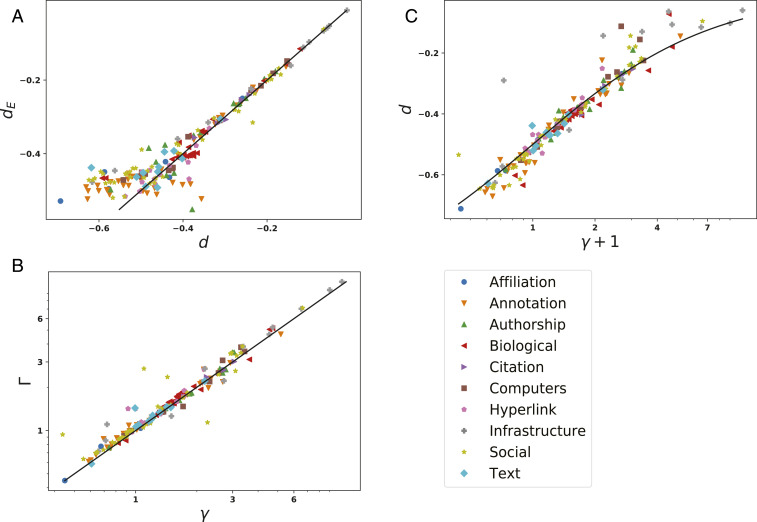
Fig. 7.
Visual summary of results from the FSS analysis, in which each network dataset is represented as a point in a specific plane. A shows the relation between and resulting from the moment ratio test, with the solid black line representing the identity. The other two panels refer to the scaling analysis with . B shows the relation between computed from FSS and from the maximum likelihood power law fit of the degree distribution (Materials and Methods). The solid line again represents the identity. C shows the relation between the exponents and of the scaling function, with the solid black line representing the curve (the text has details).

