Figure S3.
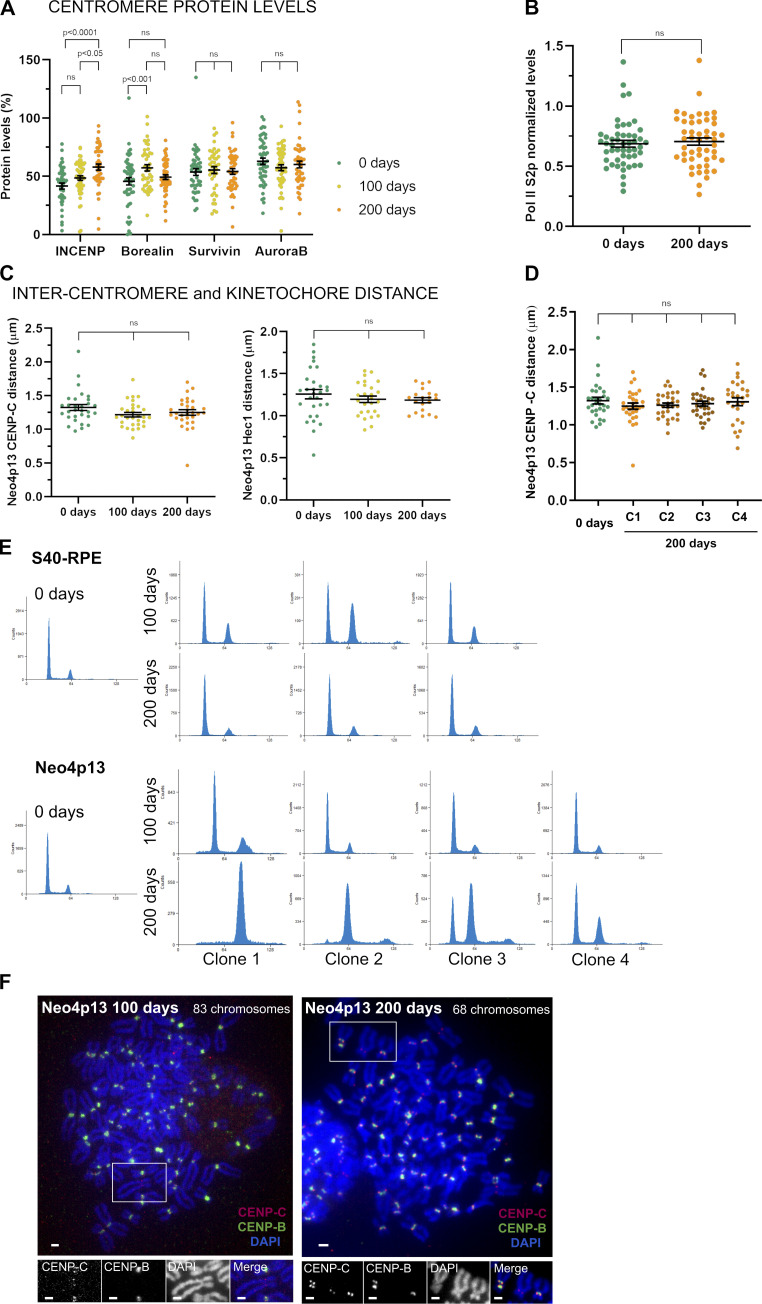
The neocentromere adapts by accumulating INCENP and Borealin. (A) CPC component protein levels at Neo4p13 at indicated times points (0, 100, and 200 d of continuous culture) measured as in Fig. 2 A. Mean and SEM of five independent experiments (n = 47–54 spreads). P values are based on one-way ANOVA with Tukey’s multiple comparison test. (B) Pol II S2p levels at Neo4p13 at 0 and 200 d of continuous culture measured as in Fig. 3 E. Mean and SEM of five independent experiments (n = 50 spreads). P values were determined as in A. (C) Intercentromere and inter-kinetochore distance at Neo4p13 at indicated time points based on CENP-C and Hec1 immunostaining measured as in Fig. 2 C. Mean and SEM of three independent experiments (n = 20–32 spreads; P values are indicated in the figure, determined as in A). (D) Intercentromere distance based on CENP-C of different clones of Neo4p13 (C1–C4, four independent clones) after 200 d in continuous culture measured as in Fig. 2 C. Mean and SEM of three independent experiments (n = 27–30 spreads). P values are defined as in A. (E) Cell cycle profiles determined by flow cytometry using PI DNA staining of S40-RPE and Neo4p13 at 0, 100, and 200 d of continuous culture. Three independent populations for S40-RPE and four for Neo4p13 subjected to long-term culture experiments are shown. (F) Representative spreads of polyploid cells of Neo4p13 cell line after 100 or 200 d in continuous culture, stained for indicated proteins and DNA (as for Fig. 2 B). A neocentromere-containing chromosome is identified by lack of CENP-B staining. Scale bars, 2 µm.

