Fig. 2.
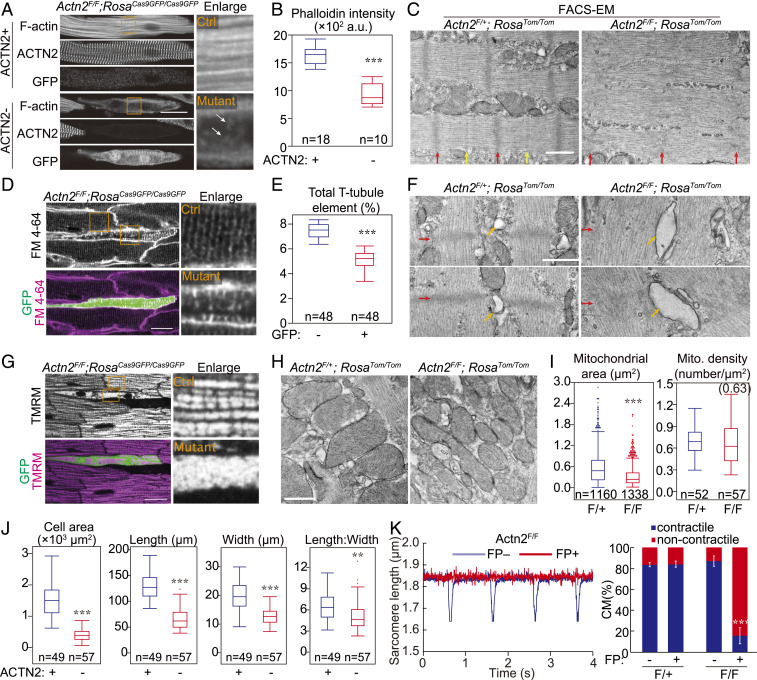
The impact of Actn2 mutation on cardiomyocyte morphological maturation. Mosaic mutation of Actn2 was achieved by low-dose AAV-Cre treatment of Actn2F/F;RosaFP/FP mice. Control cells were either FP− or ACTN2+ cells from the same heart (A, D, G, J, and K) or FP+ cardiomyocytes from Actn2F/+;RosaFP/FP mice (C, F, and H). Mice were treated on P1 and analyzed at P30. In A, D, and G, orange boxed areas are enlarged to the right. (A) Phalloidin staining on control and Actn2 mutant cardiomyocytes. The arrows point to small F-actin fragments. (B) Quantification of fluorescence intensity of phalloidin staining. (C) EM analysis of sarcomere ultrastructure in FACS-sorted Tomato+ control and mutant cardiomyocytes. Red arrows, Z-lines. Yellow arrows, M-lines. (D) Confocal optical sections of hearts perfused with FM 4-64, a dye that labels the plasma membrane. The stained membranes within cardiomyocytes are T-tubules. (E) T-tubule quantification by AutoTT software. (F) EM analysis of T-tubules in FACS-sorted Tomato+ control and mutant cardiomyocytes. Red arrows, Z-lines. Orange arrows, T-tubules. (G) Confocal optical sections of hearts perfused with mitochondrial dye TMRM. Orange boxed areas are enlarged to the right. (H) EM analysis of mitochondria. (I) Quantification of mitochondrial area and density by EM. (J) Cardiomyocyte geometry, measured on dissociated cardiomyocytes. (K) Representative traces (Left) and quantification (Right) of contractile cardiomyocytes upon electrical stimulation. The error bar is SD. n = 3 hearts per group. (Scale bars, 20 µm for A, D, and G or 500 nM for C, F, and H.) Box plots are described in Materials and Methods. Two-tailed Student’s t test versus control: *P < 0.05, **P < 0.01, ***P < 0.001.

