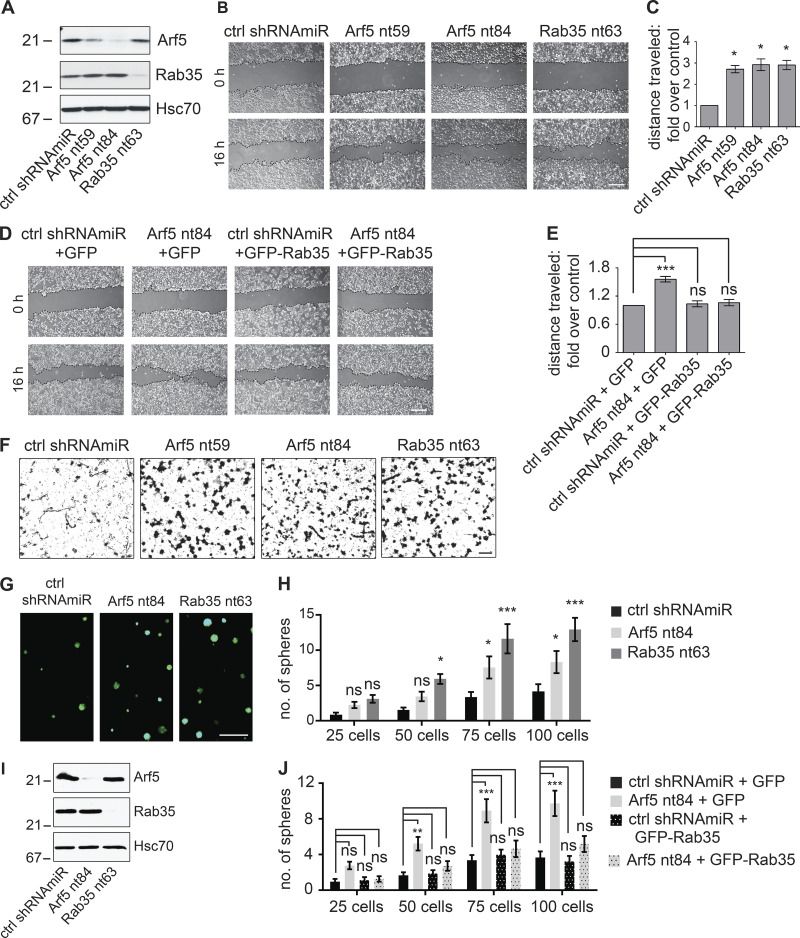
Figure 5.
Disruption of the Arf5/Rab35 axis enhances cell migration, invasion, and self-renewal. (A) COS-7 cells were transduced with a control (ctrl) shRNAmiR, two different shRNAmiRs targeting Arf5, or a shRNAmiR targeting Rab35, as indicated. Crude lysates were prepared and processed for immunoblot using antibodies recognizing the indicated proteins. The migration of molecular mass markers (in kD) is indicated. (B) COS-7 cells were transduced as in A; when confluent, a scratch was made using a pipette tip, and the images were obtained immediately (0 h) and after 16 h following the scratch. Scale bar, 200 µm. (C) Quantification of the distance of the cells traveled into the scratch in the knockdown conditions was quantified and normalized to that seen in the control shRNAmiR from experiments as in B. Data are shown as mean ± SEM. Statistical analysis employed a one-way ANOVA followed by a Dunnett’s post hoc test. *, P < 0.05; n = 3. (D) COS-7 cells were transduced with a control (ctrl) shRNAmiR plus GFP, a shRNAmiR targeting Arf5 (nt84) plus GFP, a ctrl shRNAmiR plus GFP-Rab35, and a shRNAmiR targeting Arf5 (nt84) plus GFP-Rab35, as indicated. Upon confluence, a scratch was made using a pipette tip, and the images were obtained immediately (0 h) and after 16 h following the scratch. Scale bar, 200 µm. (E) The distance the cells traveled into the scratch was quantified and normalized to that seen in the control shRNAmiR plus GFP from experiments as in D. Data are shown as mean ± SEM. Statistical analysis employed a one-way ANOVA followed by Bonferroni’s multiple comparisons test; ***, P < 0.001; n = 4. (F) COS-7 cells transduced as in A were plated on Matrigel-coated Transwell permeable supports with 8-µm pores in a Transwell chamber. After 14 h, cells on the filter in the upper well were scraped off the filter, and the cells facing the lower chamber were fixed and stained with crystal violet. Scale bar, 50 µm. (G) BT025 cells were transduced with a control shRNAmiR (ctrl) or shRNAmiRs targeting Arf5 or Rab35. Cells were than counted, and 100 cells were plated per well in 96-well plates and allowed to grow for 10 d. Resulting neurospheres were imaged using the GFP signal driven from the viral cassette. Scale bar, 500 µm. (H) Virally transduced cells as in G were diluted to 25, 50, 75, or 100 cells/well, and the number of spheres was determined after 10 d. Data are shown as mean ± SEM. Statistical analysis employed a two-way ANOVA followed by Bonferroni’s multiple comparisons test; *, P < 0.05; ***, P < 0.001; ns, not significant; n = 3. (I) Lysates prepared from cells transduced as in G were processed for immunoblot with antibodies recognizing the indicated proteins. The migration of molecular mass markers (in kD) is indicated. (J) BT048 cells were transduced with a control (ctrl) shRNAmiR or shRNAmiR targeting Arf5. After a week, the spheres were dissociated, and the cells were transduced with either GFP or GFP-Rab35 expressing lentivirus. The transduced cells were diluted to 25, 50, 75, or 100 cells/well, and the number of spheres was determined after 12 d. Data are shown as mean ± SEM. Statistical analysis employed a two-way ANOVA followed by Bonferroni’s multiple comparisons test; **, P < 0.01; ***, P < 0.001; ns, not significant; n = 4.

